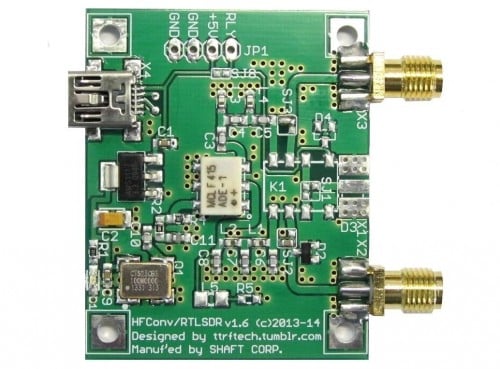
A new HF upconverter designed for the RTL-SDR has gone up on ttrftech’s Japanese language blog (use Google Translate). The upconverter is called the ‘SC-HFCONV-100’ and comes with 100 MHz oscillator, SMA connectors, USB mini-B power.
Back in June we posted about DE8MSH’s rtl_power based heatmap viewer which was automatically generated every day from a Raspberry Pi. The browser based heatmap display provides a way to view the frequency and time of where the mouse pointer is allowing you to easily identify signals.
To do this he set up a laptop in his car with RTLSDR-Scanner installed and connected his RTL-SDR with stock antenna and a GPS receiver. After driving around for only 15 minutes he was able to get a triangulation heat map of reasonable accuracy.
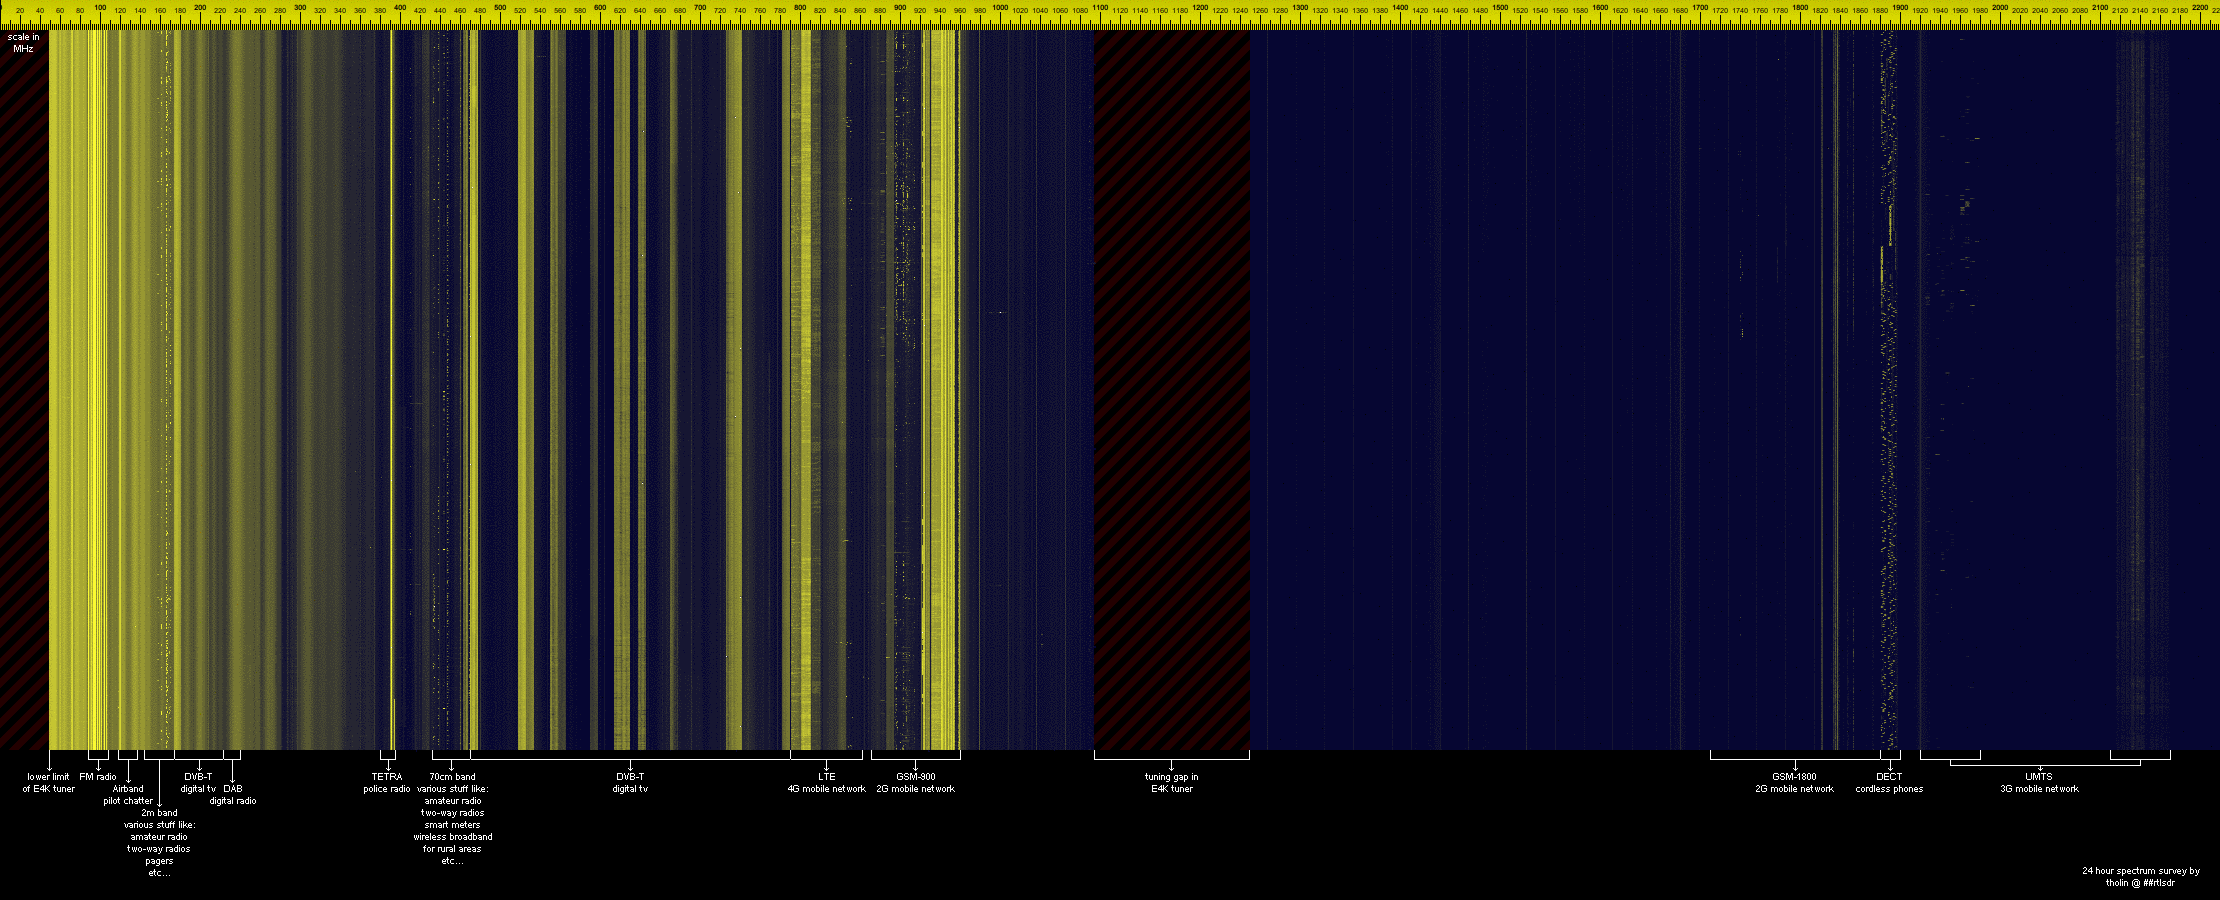
A new instructional page for the rtl_power tool is now available on main author keenerds webpage. Rtl_power is a command line tool for logging wide band frequency power scans to a CSV file. The CSV files can then be used for analysis or to create a large frequency plot image. An example of a 2 GHz+ bandwidth scan over 24 hours is shown below. Rtl_power is available as part of the official osmocom RTL-SDR drivers.
Example scan over an E4000 dongles entire frequency range.
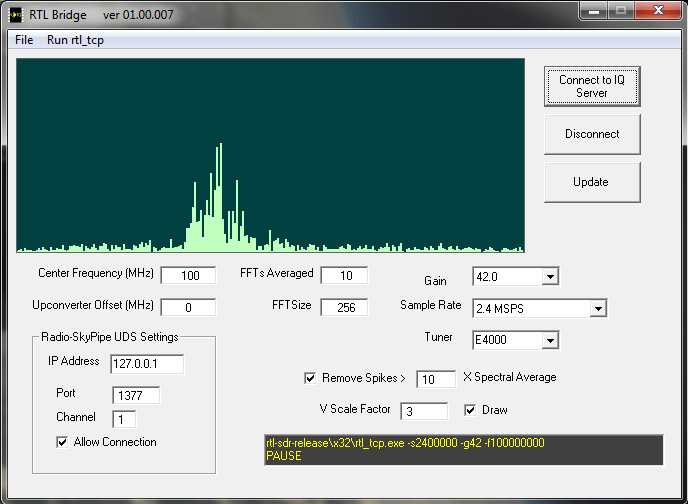
Amateur radio astronomy hobbyist Jim Sky has written on his blog about his new program called RTL Bridge with allows the RTL-SDR to directly connect to his other radio astronomy programs Radio-SkyPipe and Radio-Sky Spectrograph. Jim describes his two existing program as follows.
Radio-Sky Spectrograph displays a waterfall spectrum. It is not so different from other programs that produce these displays except that it saves the spectra at a manageable data rate and provides channel widths that are consistent with many natural radio signal bandwidths. For terrestrial , solar flare, Jupiter decametric, or emission/absorption observations you might want to use RSS.
Radio-SkyPipe is a souped-up strip chart program which plots signal strength over time. When getting its data from RTL Bridge, RSP is plotting the total power in the spectrum covered by the RTL receiver centered around its set frequency. While the raw values are proportional to power, you will have to apply a function via the RSP Equations feature to apply a calibration if you want absolute values. For signals that do not have significant spectral structure of interest, this would be the preferred way to plot the data.
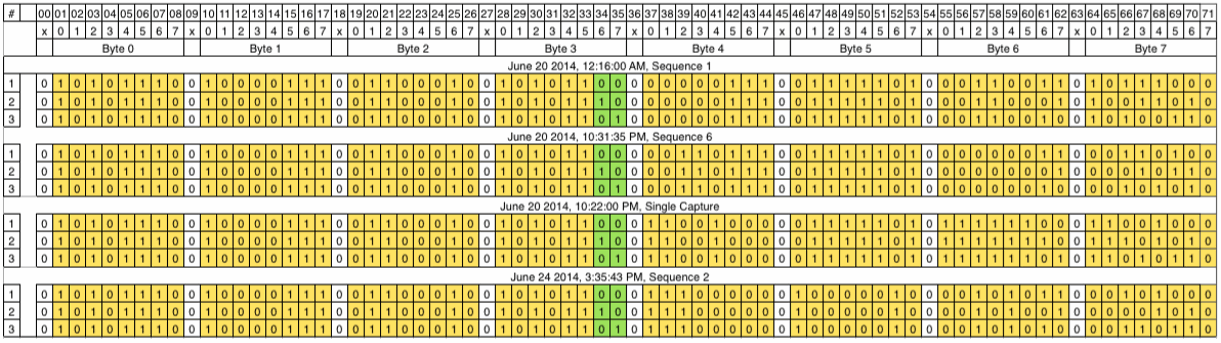
If you are interested in manually decoding some unknown signals you may be interested in this write up as it discusses his entire journey including the failures he encountered along the way. Basically he records some packets using his SDR dongle, works out their bit patterns manually and then attempts to find correlations between the packets in an attempt to discover their structure. In the end his efforts are successful as he discovers that he is receiving a temperature sensor and is able to decode the temperature readings.
This week on the popular YouTube show Hak5, SDRSharp plugins are discussed once more amongst other topics. This time at around the 17 minute mark, Shannon discusses how to install plugins that do not have automated installers. For an example she shows how to install the Level Meter plugin.
Autonomous Boats, Hacker Printers And RTL-SDR Plugins, Hak5 1623