Live Mesh Map: A Self-Hosted Live Map for Meshtastic and MeshCore LoRa Mesh Networks
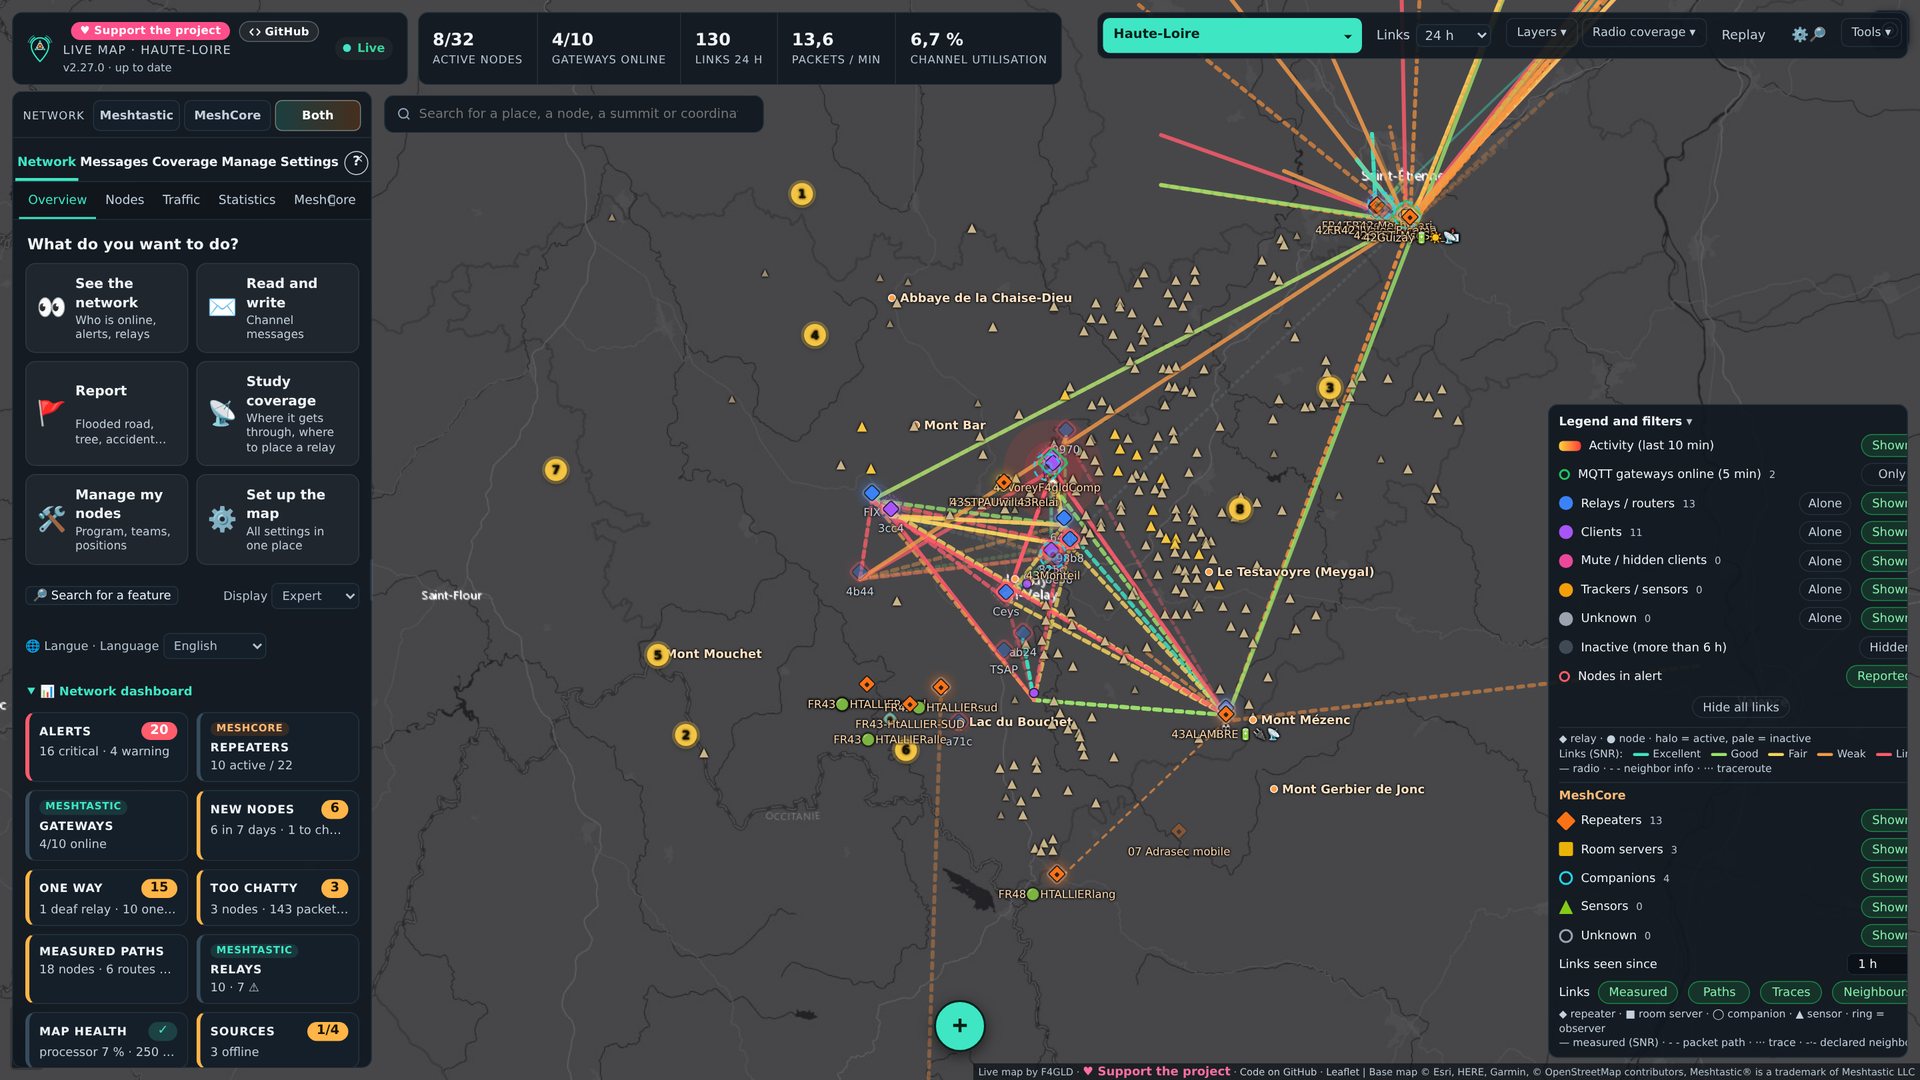
Thank you to Olivier Parriaux (F4GLD) for writing in and sharing "Live Mesh Map", a free, open-source and self-hosted live map and monitoring tool for Meshtastic and MeshCore LoRa mesh networks. We've posted about Meshtastic several times before, and Live Mesh Map can display both Meshtastic and MeshCore networks together.
Live Mesh Map takes data from a local node or an MQTT broker, decodes the mesh traffic, and plots nodes, direct RF links with SNR and RSSI, traceroutes and channel utilization live. It can also estimate terrain coverage from any point using the worldwide Copernicus 30 m DEM, rank the best hilltops for a new relay, and simulate what happens if a relay goes down. Olivier notes that the coverage model is calibrated against the links actually measured on the network. Optional layers can also show LoRaWAN devices from The Things Network and APRS stations.
The software runs in Docker on a Raspberry Pi, NAS or PC with no cloud dependency, and is available in English and French. The code is open source under the GPL-3.0 licence and available on GitHub. A live demo running on a real network in Haute-Loire, France, can be found at http://saint-appo.fr:8095/, and more screenshots are on the project's wiki.
AI Disclaimer: While the author does not disclose it, the GitHub repository contains Claude Code agent configuration files, so it is our opinion that this software may be coded with the help of AI.