Software for creating an Interactive RTL_POWER Visualization
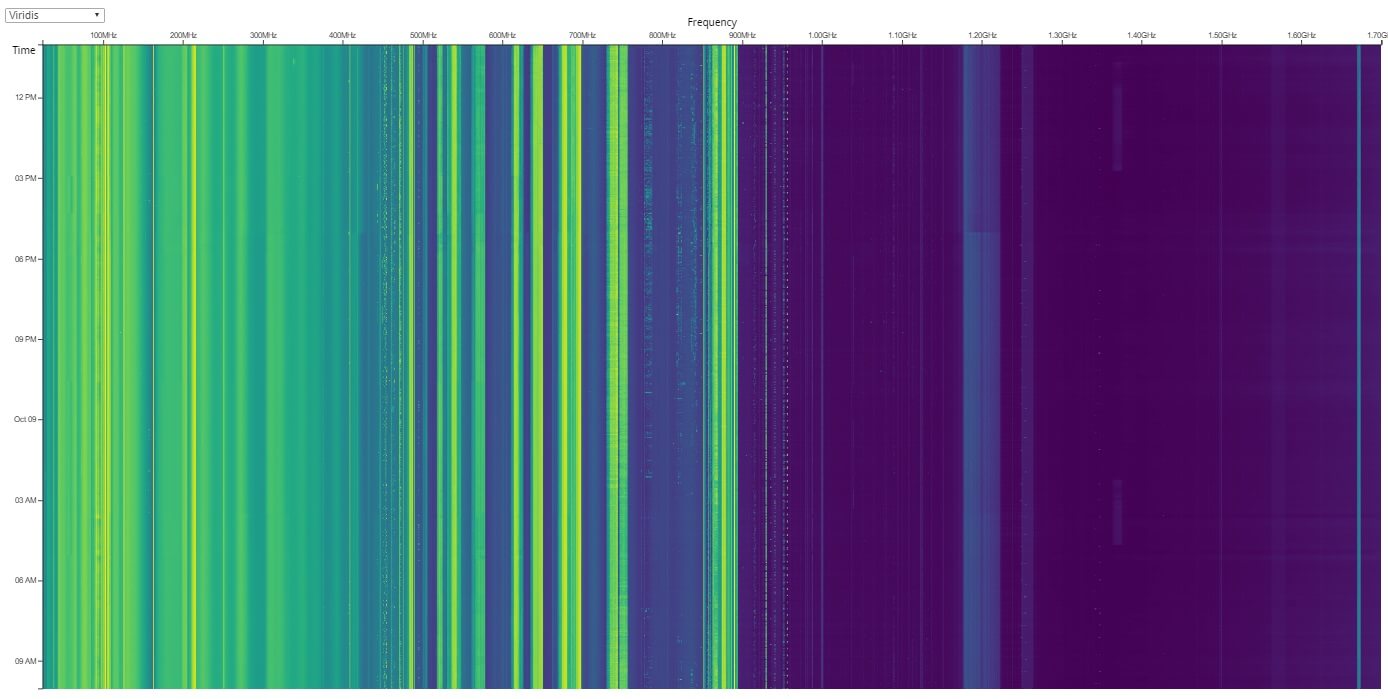
RTL-SDR.com reader Dominic Chen recently wrote in to let us know about a new piece of software he’s created. The software is called d3-waterfall, and is an interactive web based waterfall display. It takes CSV data from the commonly used rtl_power software and produces an interactive labelled waterfall which can be viewed in a web browser. rtl_power is a program that allows RTL-SDRs to produce signal power scans over an arbitrarily wide swath of bandwidth, by quickly hopping between ~2 MHz chunks of live bandwidth.
Dominics software is built using “d3.js” and HTML5. The waterfall axes are automatically labelled, there are multiple color schemes and there is pan/zoom support. The main feature is that it is mouse interactive, so when you mouse over a frequency it shows what the signal is. The default signal frequency data is taken directly from our sister site sigidwiki.com, so it may not be accurate for your particular area. But the labels are editable, so it can be customized.
An example of a previous scan can be seen on Dominic’s website (note that this is a 65mb link so be careful if you are data restricted). The software can be downloaded from its GitHub page.