RTL-SDR Tutorial: Receiving Weather Balloon (Radiosonde) Data with RTL-SDR
Around the world meteorological weather balloons are launched twice daily, and continuously transit weather telemetry to a ground station using something called a radiosonde. The RTL-SDR software defined radio combined with a decoding program can be used to intercept this telemetry, and display it on your own computer. You will be able to see real time graphs and data of air temperature, humidity, pressure as well as the location and height of the balloon as it makes it's ascent.
Note that if you are in the USA, then this tutorial may not be applicable for you as different radiosondes are used. Instead have a look at this post which shows how to use the SkySonde software from NOAA. You can also try an alternative command line based decoder called RS available on GitHub.
This tutorial is also applicable to other software defined radios such as the Funcube dongle, Airspy, HackRF, BladeRF or even hardware radios with discriminator taps, but the RTL-SDR is the cheapest option that will work.
Examples
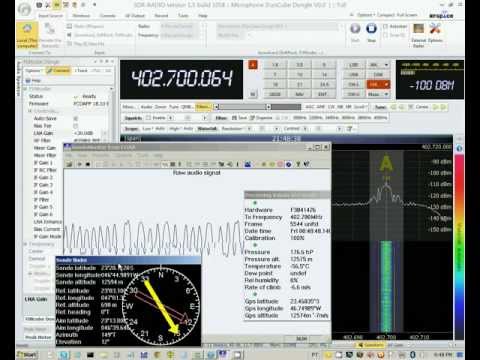
In this example YouTube user Superphish shows a radiosonde being received and decoded using a RTL-SDR, SDRSharp and SondeMonitor.
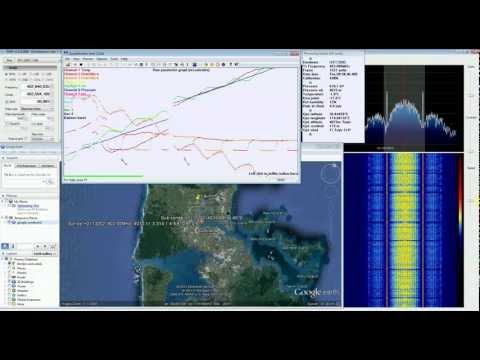
Here YouTube user py22rn shows another radiosonde being received and decoded using a Funcube dongle, SDR-RADIO and SondeMonitor.
Tutorial
Initial Setup
In order to receive and decode weather balloon radiosondes you will need four things.
- An RTL-SDR dongle set up and working with SDRSharp, or any other software defined radio with similar performance.
- An antenna capable of picking up signals near 403 to 406 MHz.
- A decoding program called SondeMonitor which is able to decode radiosonde telemetry.
- The knowledge of when and optionally where weather balloon radiosondes are launched in your area.
We will assume you have the RTL-SDR dongle set up and working already. If you have not bought a dongle yet, see the Buy RTL-SDR page for information on the best places to buy dongles and then check out the Quickstart Guide for an easy setup routine with SDRSharp. You will also need to have an audio piping method installed and set up. Audio piping will allow the audio from SDRSharp to be passed to a decoding program. You can use either windows stereo mix, VB-cable (free) or Virtual Audio Cable (paid with trial version).
Antennas
Radiosonde signals typically get good radio reception with any antenna tuned to 403 MHz as they transmit from high in the sky where there are no obstructions. Some antennas to try are 1/4 ground plane antennas, J-Pole antennas and collinear antennas. Discone antennas may also work well.
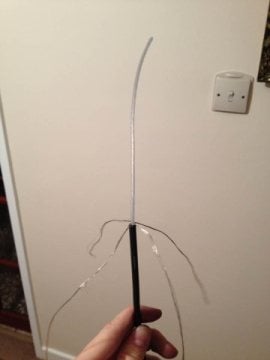
Quarter Wave Ground Plane Antenna
Using this calculator, dimensions for a simple 1/4 wave ground plane antenna for 403 MHz can be calculated. The Stratodean amateur high altitude ballooning team used a very simple 1/4 ground plane made out of RG58 coaxial cable.

Twin Lead J-Pole
A super easy J-Pole can be constructed out of twin lead cable. Using these plans and this calculator, a twin lead J-Pole can be designed.
Decoding Radiosonde Telemetry
Weather balloons most commonly transmit at around ~403 MHz and are launched around the world at the official observation time of around 0000 UTC and 1200 UTC. You will need to either Google or check with your local meteorological agency for a more exact time of when they are launched in your area.
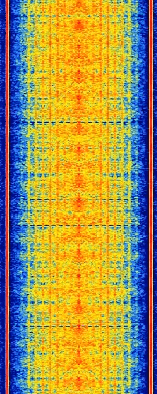
One of the most commonly used radiosonde signals is the Vaisala RS92SGP digital signal. A waterfall example of this signal is shown on the below and a sound sample is provided further down. SondeMonitor is a Windows decoder which is able to decode Digital RS-41, RS92SGP, Analogue RS92AGP, Analogue RS80, Analogue 92KL, Graw DFM-06, MeteoModem M2K2/M10 and Meteolabor SRS-C34. If you discover a different signal to the RS92SGP example provided here, you will need to experiment in SondeMonitor to find the protocol which works.
More radiosonde signal and video examples can be found over on Sigidwiki.com.
To decode weather balloon radiosondes follow these steps:
- Download and install SondeMonitor. SondeMonitor is paid software with a reasonable 25 euro price tag, but comes with a 21 day trial. Download SondeMonitor from this page.
- When a weather balloon is due to be launched, open SDRSharp, set your audio piping method under the Audio Output drop down box and tune to a frequency between 403 and 406 MHz. Scan around and look for a radiosonde signal, tune to it and adjust the RF gain settings for best performance. Set the receive mode to NFM and filter audio to OFF. Adjust the filter bandwidth so that it just covers the signal.
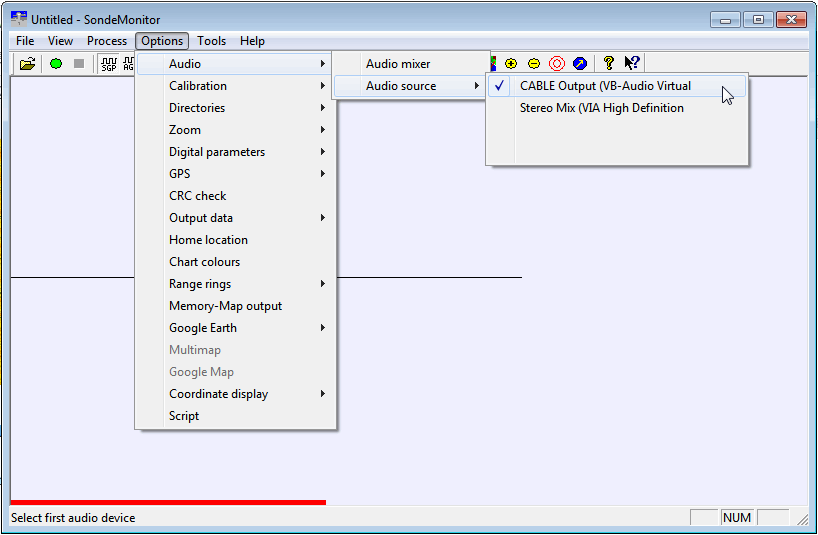
- Open SondeMonitor. (NOTE: In Windows 10 you must open SondeMonitor as Administrator - right click shortcut, choose run as administrator) Go to Options -> Audio -> Audio Source and choose the audio piping method you are using.
- Select the radiosonde decoding protocol used in your area. These can be selected with the icons just to the right of the green circle start and square stop icons. Hovering over the icons will show what they are. If you are unsure, you might try experimenting with each one.
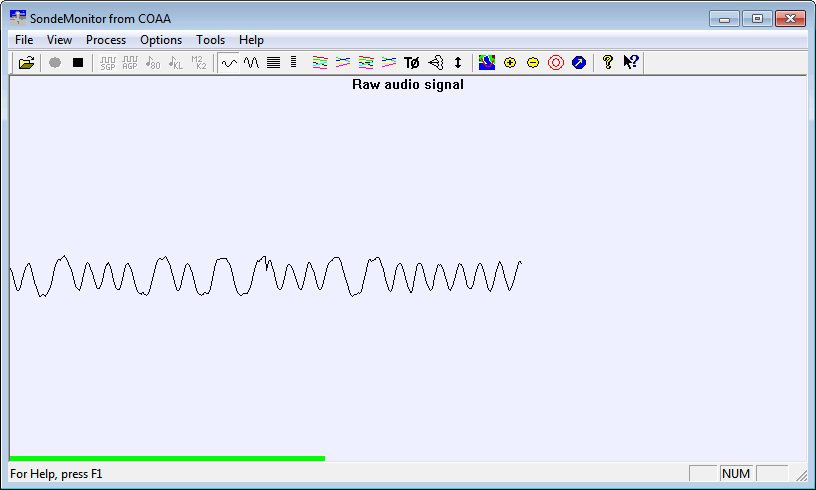
- Now start the decoding by clicking the green circle. A telemetry data window will pop up. Next, click on the raw signal icon, which looks like a squiggle. Adjust the volume in SDRSharp or Windows volume settings so that the audio graph is loud enough to be visible, but not too loud as to cause clipping (square waveform).
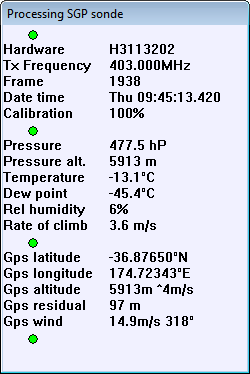
- At this point, if your signal reception is good, and you have selected the correct decoding method, the telemetry window will show data and have four green circles. Note, that SondeMonitor requires some initial time to calibrate. The completed amount of the calibration process can be seen in the red bar in the lower left corner, which will slowly turn all green as calibration completes. The calibration status can also be tracked in the telemetry window. If calibration does not complete, or takes a very long time, it means your signal strength is not good enough.
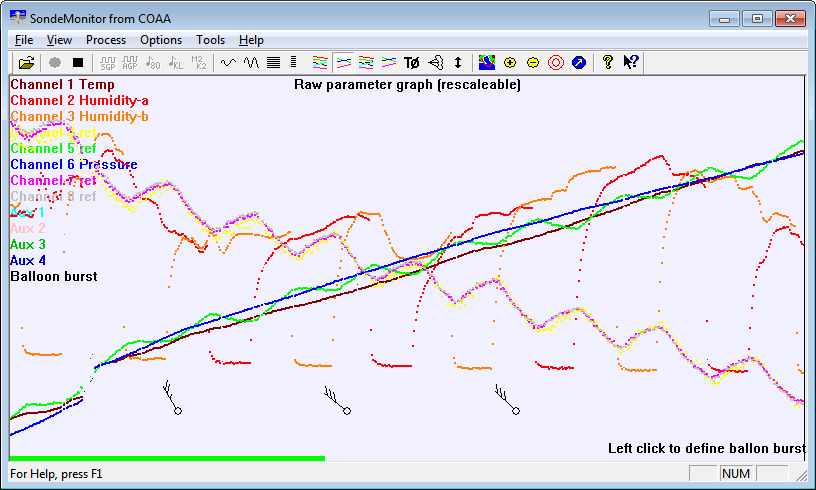
- Click on the Graph 2 icon to see telemetry graphs. You can click the Autoscale icon which looks like a double ended vertical arrow to ensure that all the data is displayed on the screen.
GPS Radiosonde Location Tracking
For most launches, the weather balloon's location and altitude can be tracked live in Google Earth. Some radiosondes such as the RS92SGP do not transmit latitude and longitude GPS data. Instead, they transmit raw GPS data, which must be converted into longitude and latitude on the receiving end (your computer). To do this, the radiosonde's starting coordinates, UTC launch date and UTC time, and an up to date GPS almanac are required. The almanac is a data file that stores information about the GPS satellite locations. The MeteoModem M2K2/M10, Graw DFM-06 and Meteolabor SRS-C34 are radiosondes which transmit already decoded location data. The following steps are for the other radiosondes which transmit raw GPS data, such as the RS92SGP.
- Download an up to date Almanac from the US Coast Guard Nav Center. You will want to get the current SEM Almanac with the .al3 extension.
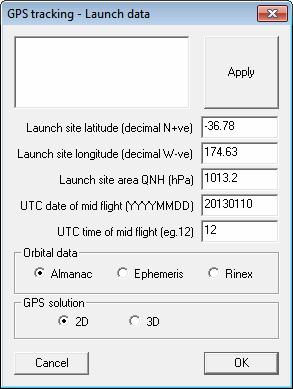
- In SondeMonitor, go to Tools -> GPS Arm. Enter the Latitude and Longitude of the weather balloon's launch location. You will also need to enter the UTC date of the flight, and the approximate UTC time at mid flight. Make sure the date and time is in UTC time. Weather balloons last about 2-4 hours, so just estimate a mid flight time. Select Almanac as your Orbital data. The other options can be left as default.
- Once you press OK, a file selection dialog box will pop up. Browse to the folder your current .al3 Almanac file is stored in, and open it. Now, if you have set the Almanac, start coordinates, and date and time up correctly, the GPS Residual in the SondeMonitor telemetry status window will be to within a couple of hundred meters. The smaller the residual, the more accurate the weather balloon location is. If you have gotten any parameters wrong, the residual will be very large.
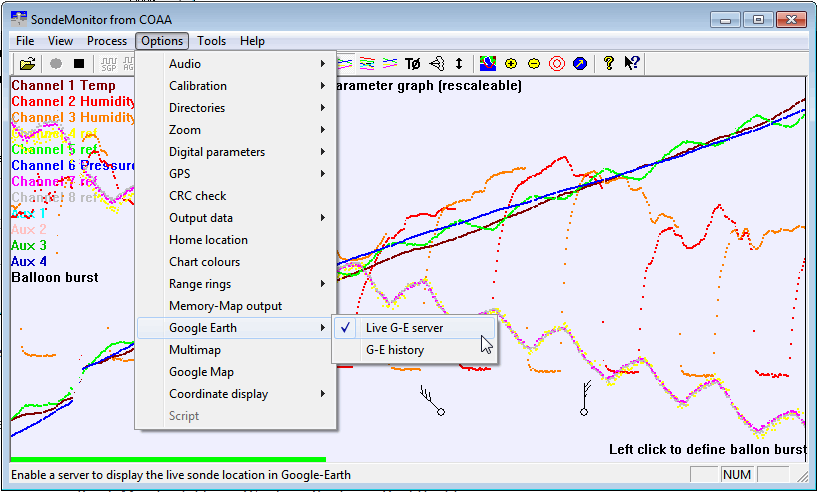
- To see the balloon in Google Earth, go to Options -> Google Earth and ensure that Live G-E Server has a check next to it by clicking it if it does not.
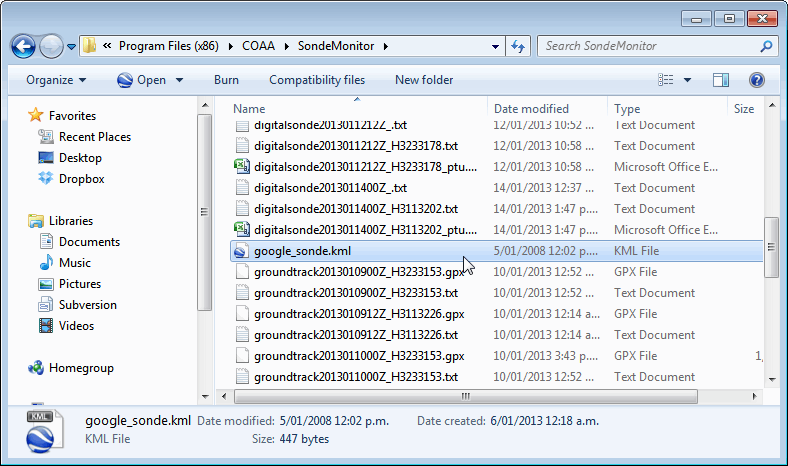
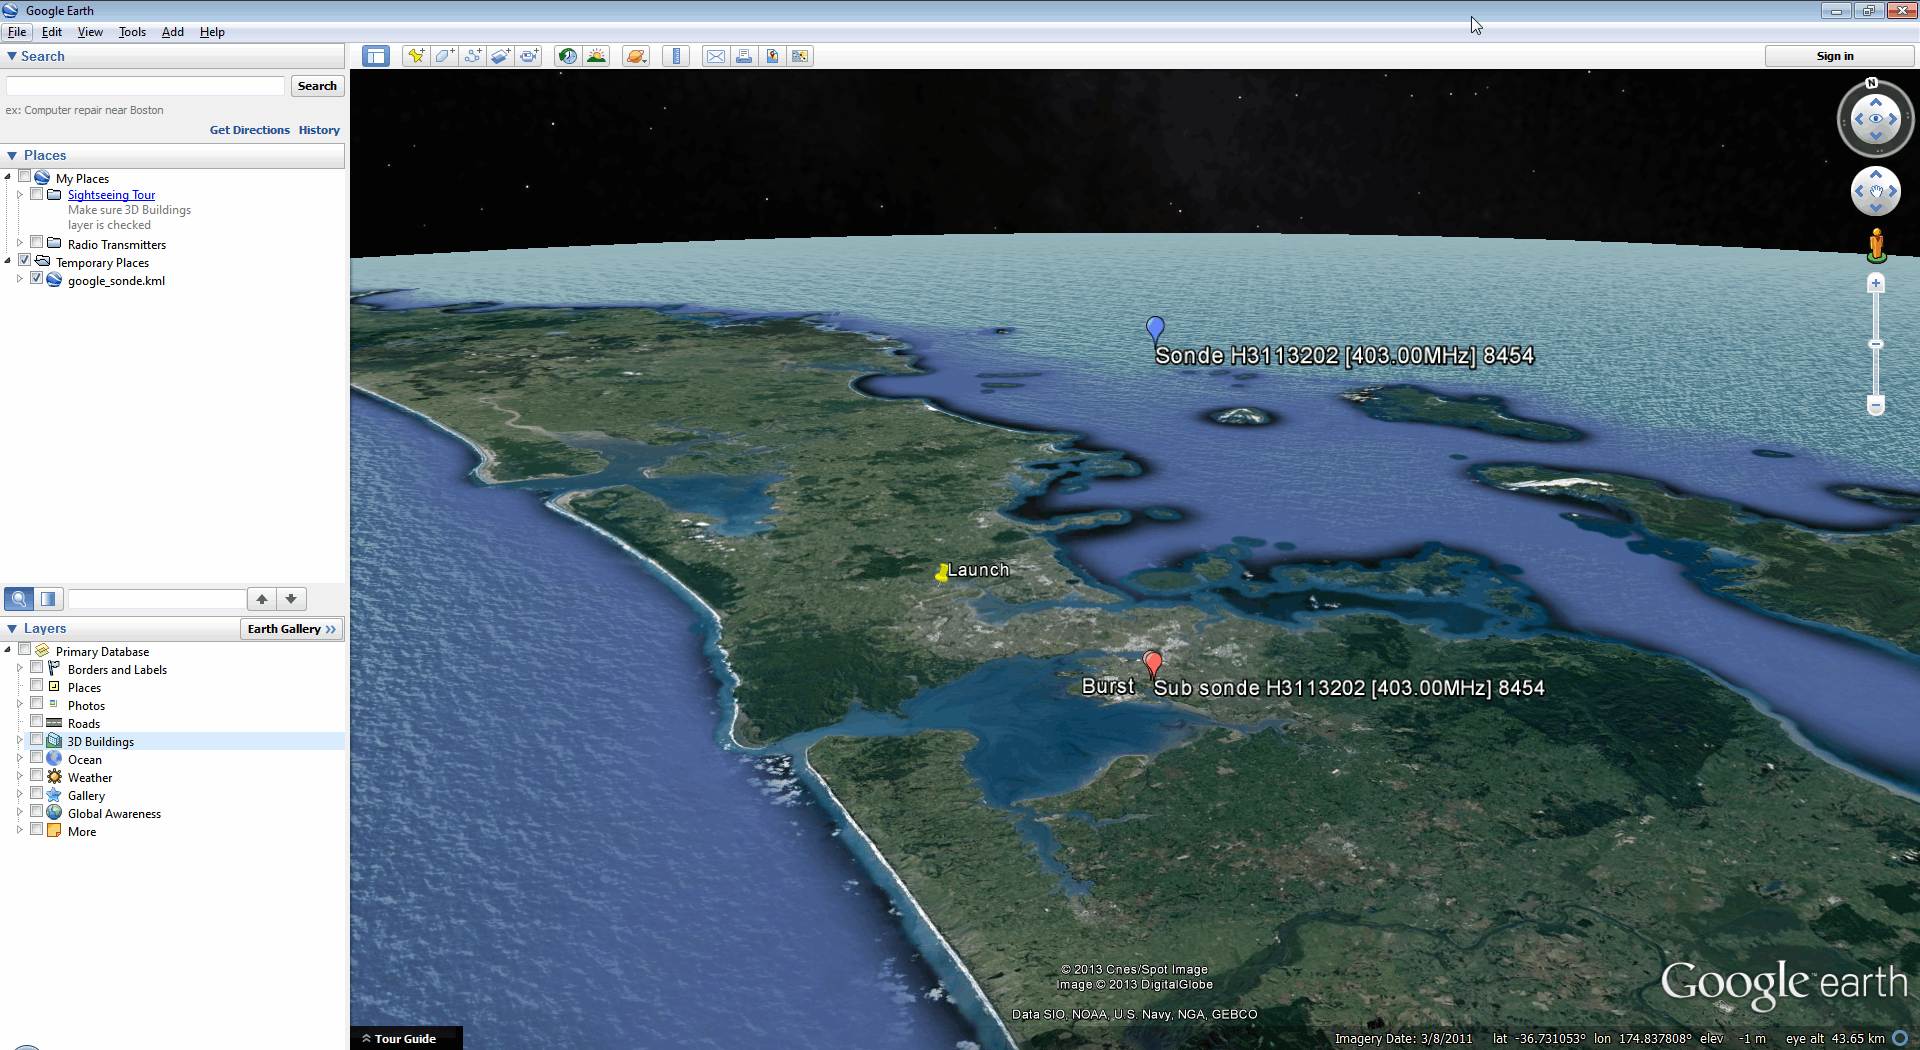
- Now open your SondeMonitor folder in Windows Explorer. Find the file google_sonde.kml, and open this file with Google Earth. You should now be able to see the weather balloon's launch location and current live location in Google Earth.
Other Radiosonde Decoding Software
RS: This is a free command line based program which can decode multiple radiosonde protocols. Unlike Sondemonitor it however does not provide any graphs, just raw data.
Tracking your own High Altitude Balloons
Some hobbyists enjoy launching their own balloons to take video and photography of the earth. It is legal to launch your own high altitude balloons with permission from your Civil Aviation Authority. Blogger nerdsville has been keeping tabs on the Stratodean team who have launched their own high altitude balloons and use the RTL-SDR to track them. A good video showing an overview of their SDR tracking system can be found here. More information about Amateur high altitude ballooning can be found here.
Some Tips
- A good outside antenna is required to receive radiosonde signals. Ensure the antenna is placed as high as possible.
- A low noise amplifier (LNA) such as this one or this one placed near the antenna may help with weak signals.
- The signal frequency may bounce around a lot. This is because the radiosonde can pass through several atmospheric disturbances.
- The YouTube video by Superphish shown at the beginning of this article can be used to test Sondemonitor by using Stereo Mix. Although, testing the GPS tracking will not be possible.
 If you enjoyed this tutorial you may like our book available on Amazon. Available in eBook and paperback formats. The Hobbyist's Guide to the RTL-SDR: Really Cheap Software Defined radio. |


If you prefer SDR Console V3 choose WFM and make a 6kHz filter. Very responsive and quicker lock than SDR# is my experience.
Recently from RTL SDR facebook group I found this nice software to decode Vaisala RS41
http://escursioni.altervista.org/Radiosonde/index.php
Hope you can include them in the post!