Further Tutorials on SatDump Map Projections
Thank you to Paul Maine, who has submitted to us two new SatDump tutorials that he has uploaded to his YouTube channel. These two tutorials follow on from his previous tutorials that we posted a month ago.
His SatDump V2.x Part 5 video demonstrates Recording and Processing. Paul shows his hardware setup and then shows GUI Live Processing, CLI Live Processing, CLI Recording and how to use the GUI to process recorded files.

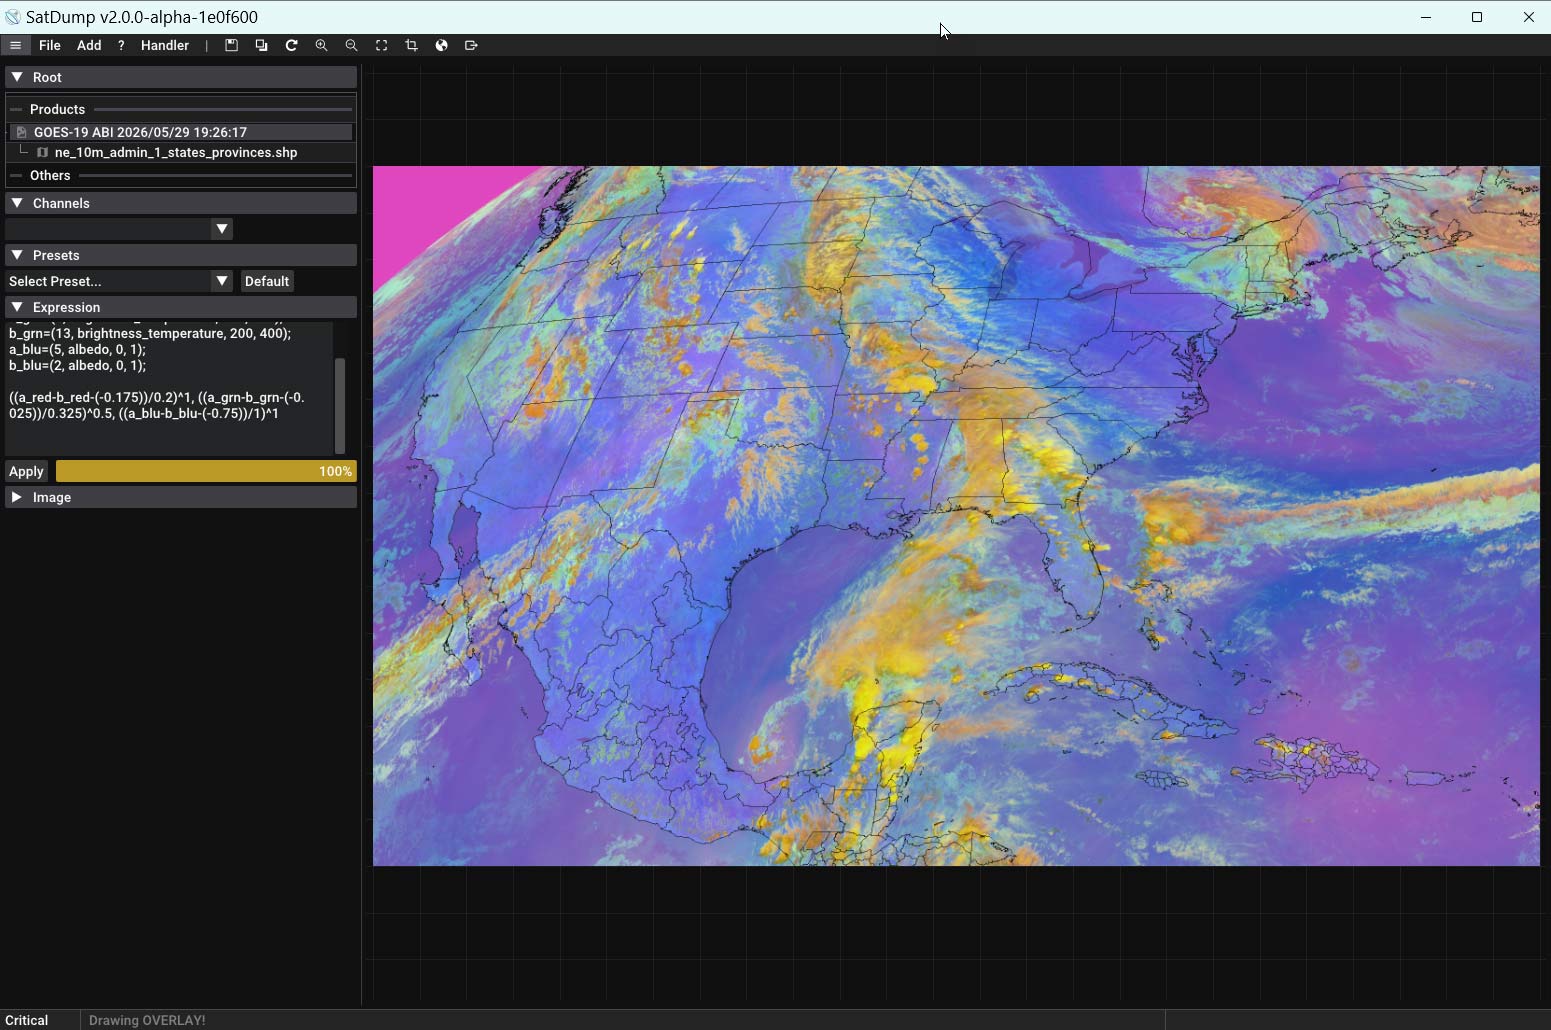
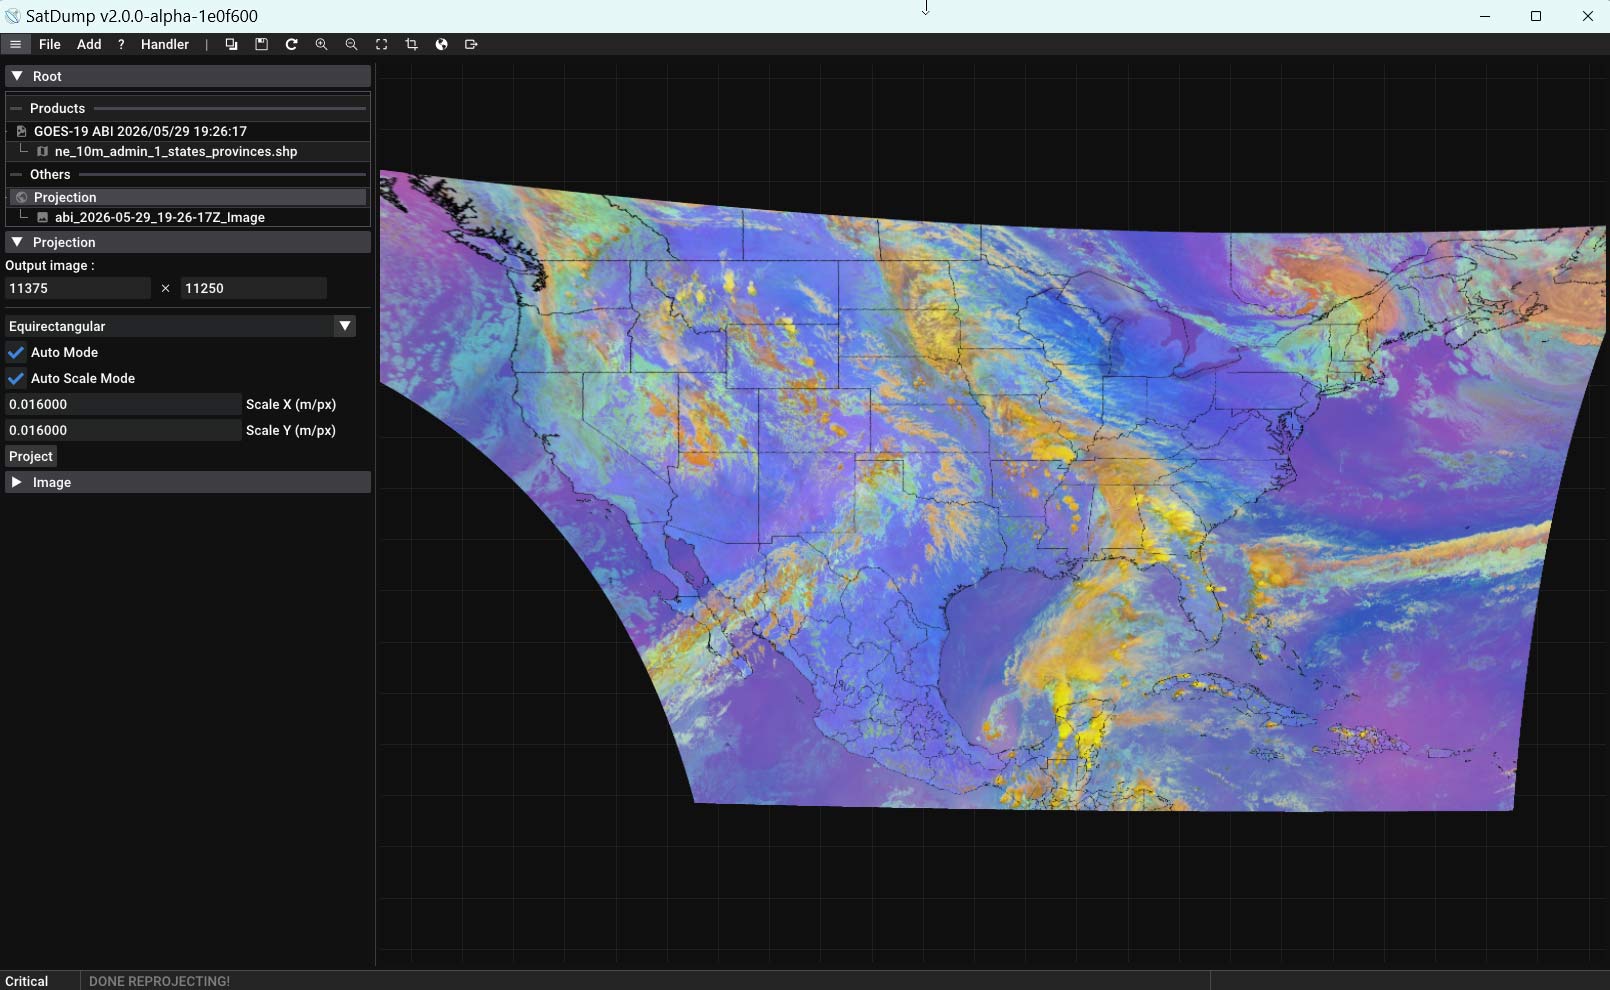
His SatDump V2.x Part 6 video on Projections introduces Map Projections. Paul uses things covered in earlier SatDump videos and builds upon them to create very interesting map projections. For his first example, he uses the Load First Party feature to download a GOES-19 CONUS image. Next, he shows how to add a shape file and a Severe Storms image expression. Lastly, he shows how to create an equirectangular map projection. In the video, Paul also shows how to create three other types of projections.