Downloading Stored Images and Data from the NOAA Weather Satellite GAC Broadcast
With polar orbiting weather satellite reception we as amateur ground station operators with SDR receivers typically download images via "Direct Broadcast", which provides imagery of what the satellite is currently seeing live. However, the main way satellites such as the NOAA POES (NOAA 15, 18 & 19) satellites downlink is via "Global Area Coverage" (GAC) broadcast which provides the full stored imagery data of the entire global pass. However, GAC is only broadcast in locations where the satellite operator operates ground stations.
Over on YouTube dereksgc has uploaded a video showing how to receive GAC data from the NOAA POES satellites. He notes that GAC is now broadcast at 2247.5 MHz in the S-band, and the ground station it now downlinks to is likely in Svalbard, rather than in the USA. This means that amateur satellite stations close to the North Pole can receive the GAC signal, including dereksgc's station which (we believe) is in the Czech Republic.
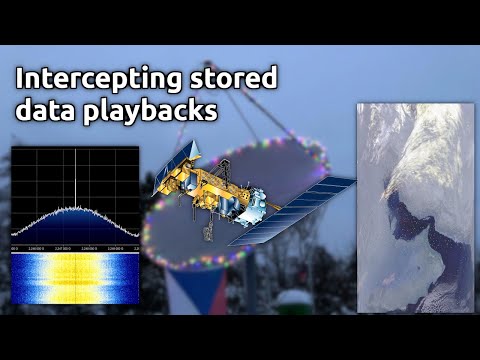
Dereksgc uses a large 250cm offset dish with S-band feed connecting to a HackRF. In the video he demonstrates him receiving the signal, and then decoding it using SatDump. Finally he shows all the images from various locations around the earth that he was able to receive from one satellite pass.