Measuring Traffic in a Neighborhood with KerberosSDR and Passive Radar
KerberosSDR is our four tuner coherent RTL-SDR product made in collaboration with Othernet. With KerberosSDR applications like radio direction finding and passive radar are possible, and our free open source demo software helps to make it easier to get started exploring these applications. In this post we explore how a simple passive radar setup can be used to measure how busy a neighborhood is in terms of vehicular traffic.
KerberosSDR is currently available from the Othernet store for US$149.95, and the setup guide is available at www.rtl-sdr.com/ksdr.
Passive radar makes use of already existing strong 'illuminator' signals such as broadcast FM, DAB, digital TV and cellular. When these signals reflect off a moving metallic object like an aircraft or vehicle, it distorts the signal slightly. By comparing the distorted signal to a clean signal we can determine the distance and speed of the object causing the reflection. Wide reaching digital signals like DVB-T and DAB are often the best illuminators to use. Wideband cellular signals can also be used to detect more local targets.
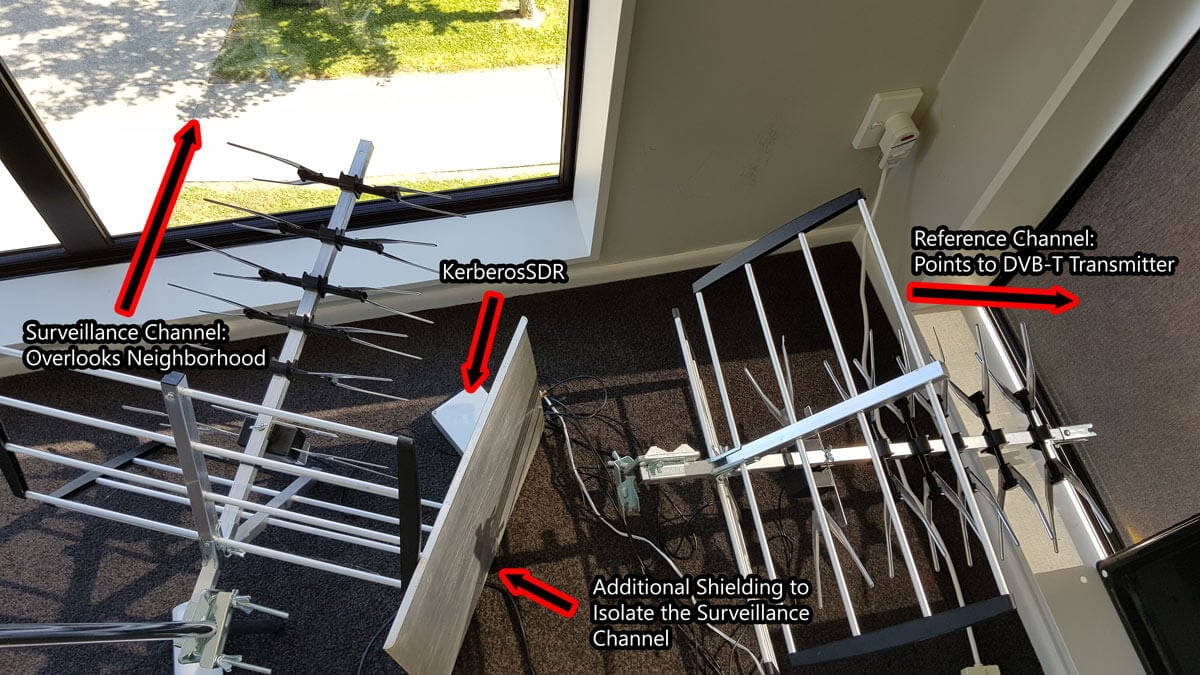
In a simple passive radar system we use two directional antennas such as Yagi's. One Yagi points towards the broadcast tower and receives the clean non-distorted reference signal. This is known as the reference channel. A second Yagi points towards the area you'd like to monitor for reflections, and this is called the surveillance channel.
In our setup we point the reference channel Yagi towards a 601 MHz DVB-T transmitter roughly 33 km away. A second Yagi is placed on a vantage point overlooking a neighborhood. The Yagi's used are cheap DVB-T TV Yagi's that can be found in any electronics or TV retail store (or on Amazon for ~$30 - $60 USD). In the software we used a bandwidth of 2.4 MHz and adjusted the gains for maximum SNR.
It is important that the surveillance channel is isolated from the reference signal as much as possible. We improve the isolation simply by placing a metal sheet next to the surveillance Yagi to block the reference DVB-T signal more. Note that putting the antennas outside will obviously result in much better results. These walls and windows contain metal which significantly reduce signal strength. We also added our RTL-SDR Blog wideband LNA to the surveillance channel powered by a cheap external bias tee to improve the noise figure of the surveillance channel.

The resulting passive radar display shows us a live view of objects reflecting. Each dot on the display represents a moving vehicle that is reflecting the DVB-T surveillance signal. In the image shown below the multiple colored objects in the left center are vehicles. The X-Axis shows the distance to the object, and the Y-Axis shows the doppler speed. Both axes are relative to the observation location AND the transmit tower location.
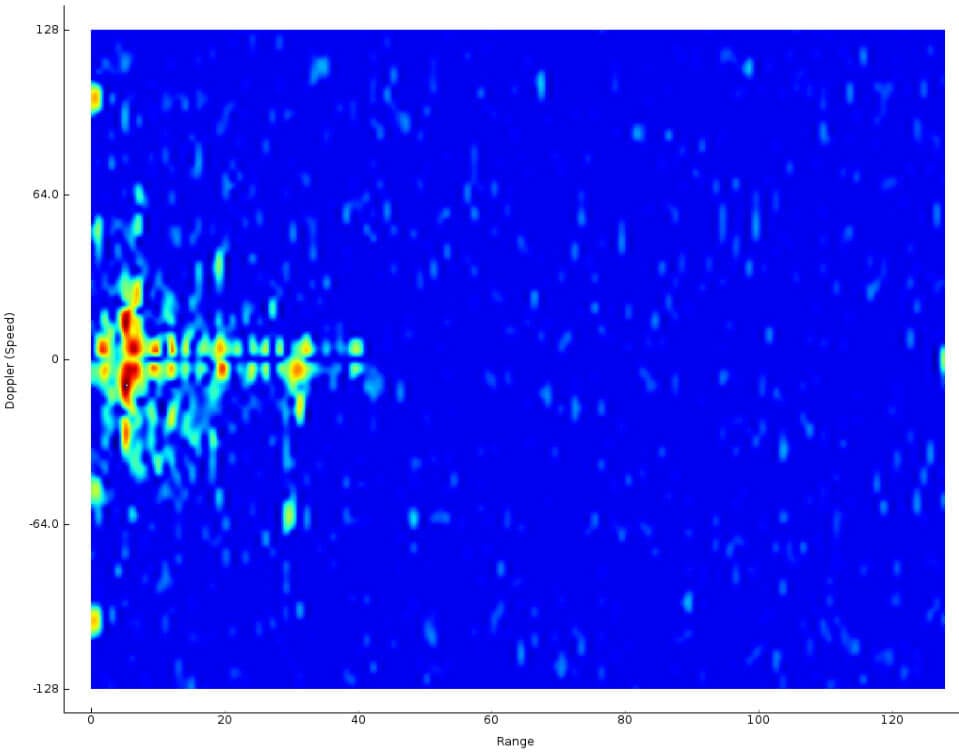
When there are more moving cars on the road during the day and rush hours, there are more blips seen on the passive radar display. Larger vehicles also produce larger and stronger blips. By simply summing the matrix that produces this 2D display, we can get a crude measurement of how busy the neighborhood is, in terms of cars on the road since reflections are represented by higher values in the matrix. We logged this busyness value over the course of a day and plotted it on a graph.
The resulting graph is as you'd intuitively expect. At 6AM we start to see an increase in vehicles with people beginning their commute to work. This peaks at around 8:30AM - 9am with parents presumably dropping their kids off to the neighborhood school which starts classes at 9AM. From there busyness is relatively stable throughout the day. Busyness begins to drop right down again at 7PM when most people are home from work, and reaches it's minimum at around 3am.

One limitation is that this system cannot detect vehicles that are not moving (i.e. stuck in standstill traffic). Since the doppler speed return will be zero, resulting in no ping on the radar display. The detection of ground traffic can also be distorted by aircraft flying nearby. Aircraft detections result in strong blips on the radar display which can give a false traffic result.
It would also be possible to further break down the data. We could determine the overall direction of traffic flow by looking at the positive and negative doppler shifts, and also break down busyness by distance and determine which distances correspond to particular roads. In the future we hope to be able to use the additional channels on the KerberosSDR to combine passive radar and direction finding, so that the the blips can actually be directly plotted on a map.
If you want to try something similar on the KerberosSDR software edit the RD_plot function in the _GUI/hydra_main_window.py file, and add the following simple code before CAFMatrix is normalized. You'll then get a log file traffic.txt which can be plotted in excel (remember to convert Unix time to real time and apply a moving average)
CAFMatrixSum = np.sum(CAFMatrix)
trafficLog = open("traffic.txt", "a")
logString = str(round(time.time())) + "," + str(round(CAFMatrixSum)) + "\r\n"
trafficLog.write(logString)
trafficLog.close()


Very nice 🙂 great work tnx.
One idea to eliminate the airplane false positives is to cross reference the data in that are with flightradar data.
2 questions 🙂
– Could this be used for detecting humans on an area of say 1 mile or maybe around 1000 meter circle for perimeter detection?
– Could the data be overlaid on google maps for example to display movement on a map?
Interesting but the human body absorbes RF and doesn´t reflect electro-magnetic signals. The map overlay for google sounds good for “moving” objects that do reflect.