Recently, we posted about DeepSDR, which is a program that automatically transcribes voice data from public safety radio communications and uses an LLM to categorize and plot incidents on a map as they happen.
In that post, we noted that we expect to see more projects like this soon, and sure enough, another program called "Scanner Command" with a similar angle has been submitted to the blog by author Benjamin Blood. Like DeepSDR the software listens to public safety and then uses voice transcription and an LLM to automatically understand, categorize and map incidents on the map. One additional feature that Scanner Command has is a fun tool that correlates ADS-B data with airband voice. Benjamin explains it best:
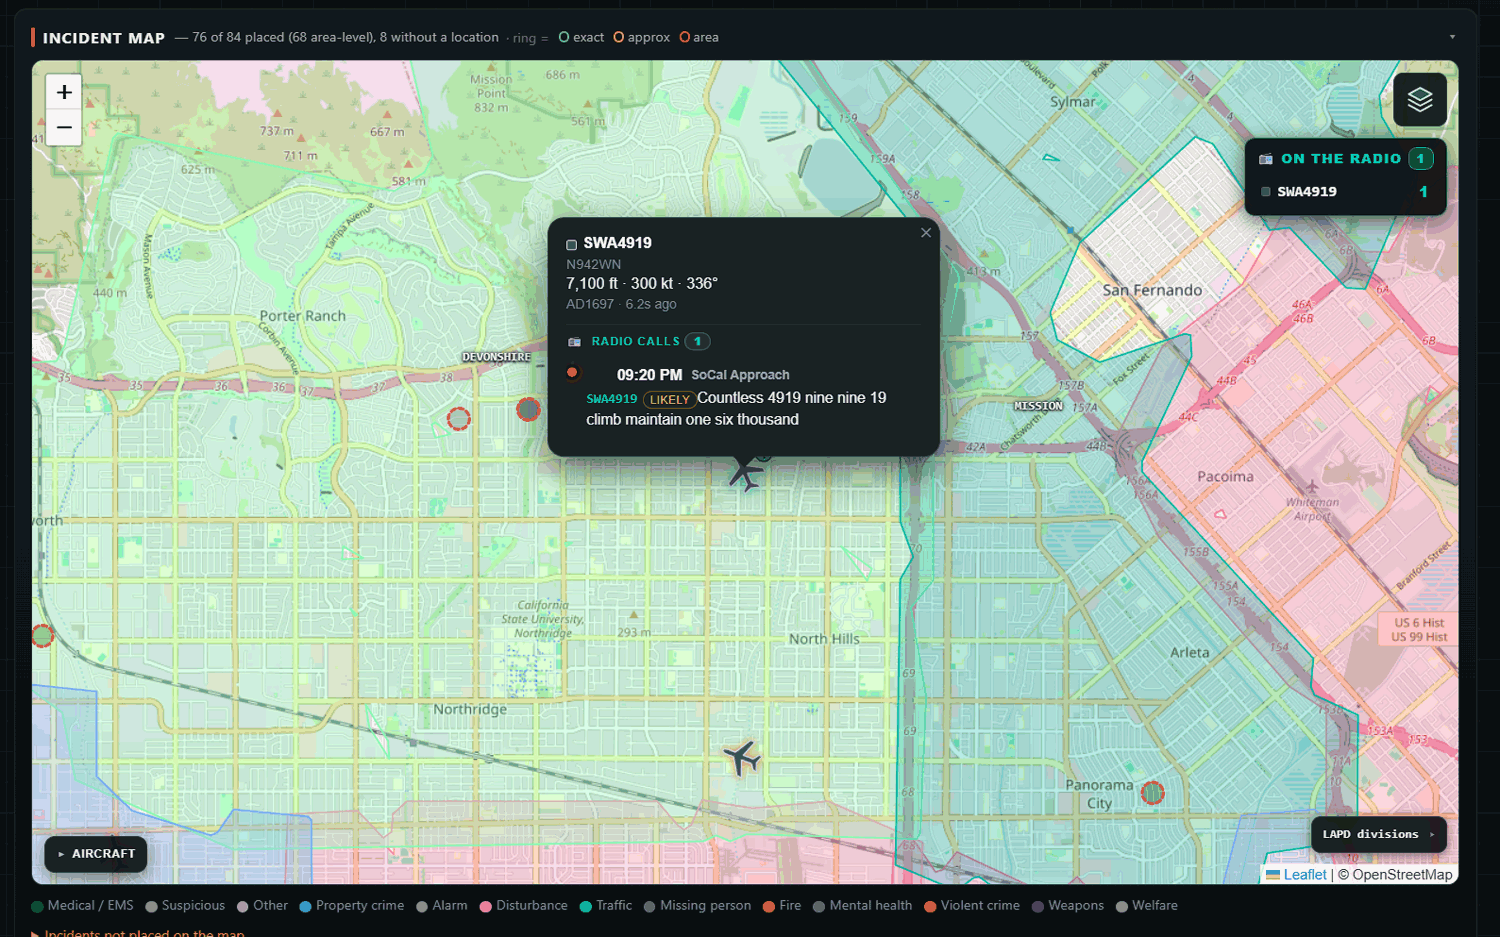
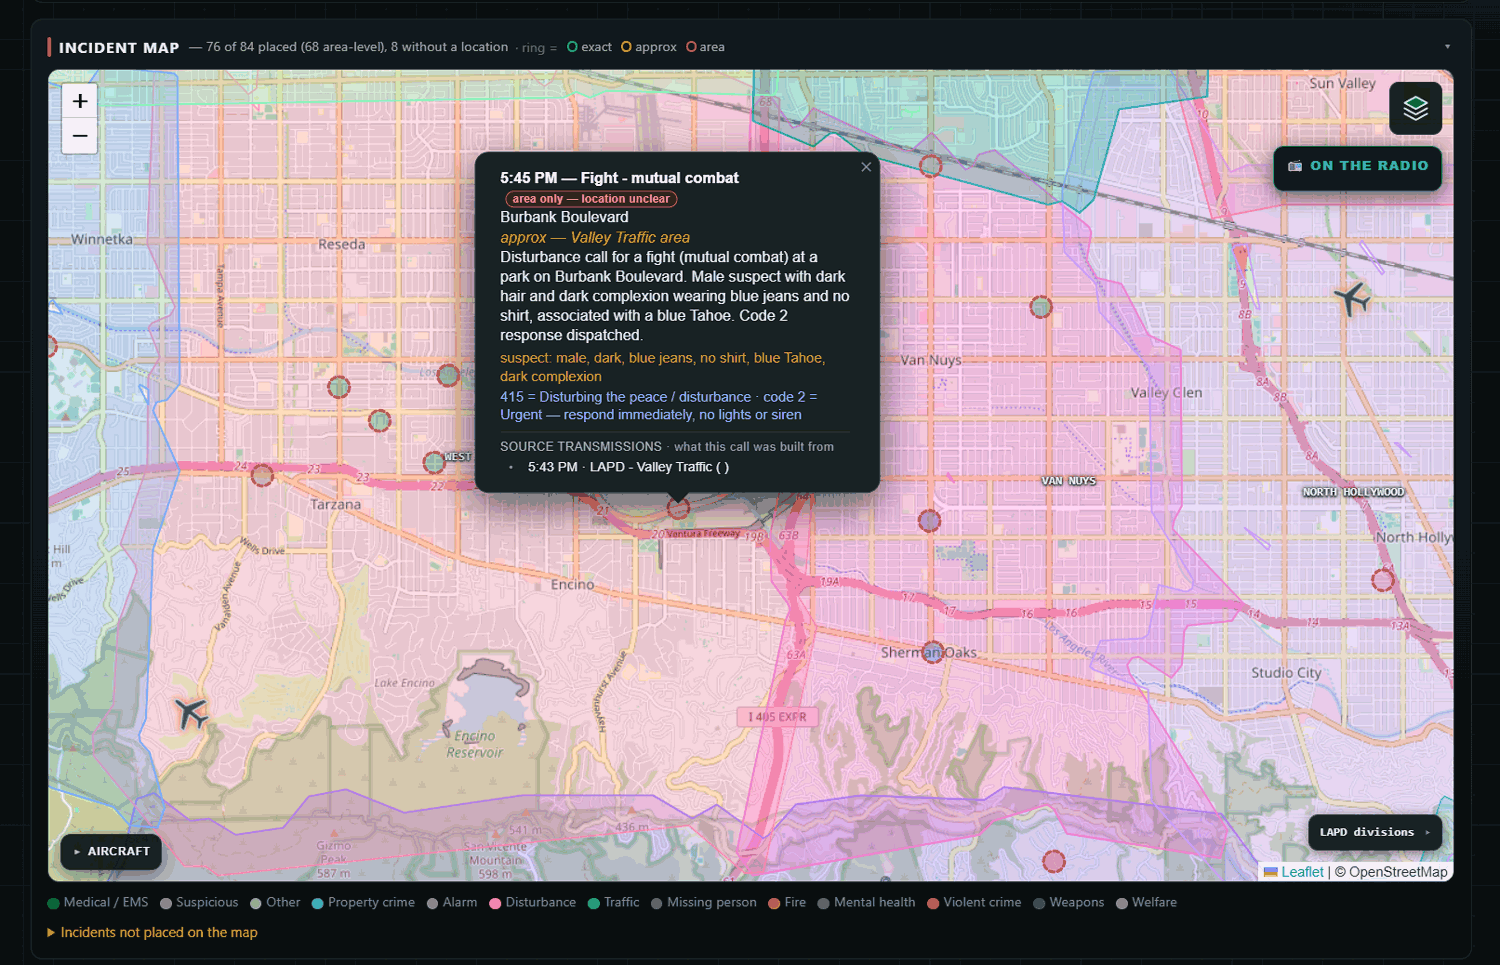
Scanner Command turns a radio scanner into a live AI incident map. A Uniden SDS200 covers the trunked digital public safety side (the LA area's P25 Phase II system, with ProScan driving the scanner and handing off every recording), and two $45 RTL-SDR dongles handle the rest, one decoding ADS-B with readsb, one capturing VHF airband transmission by transmission. Everything gets transcribed locally with Whisper, an AI extraction pass works out what happened and where, and about 30 seconds after a call ends it's a color-coded pin on the map with the audio one click away. Location matching is honest on purpose: an exact intersection match gets a solid pin, an area-only match gets a dotted one, and it tells you which.
Here's the design idea underneath it, and what I think separates it from the other transcribe-and-map projects out there: this is built for tactical situational awareness when the grid's down. The system does its learning while it's online, building its own gazetteer of local streets and places, learning unit callsigns and talkgroup names, priming the transcriber's vocabulary from real local traffic, precisely so it's more capable when it's cut off. Map tiles, geocoding, and hazard data are all cached locally with that scenario in mind.
The picture in my head has always been: grid's down, the box is running on backup power serving wifi, and my neighbors connect with their phones and everyone can see what's happening around us, instead of one guy hunched over a scanner relaying it. It's not shelf gear you dust off when something happens; the whole point is that running it every day is what trains it for the day you need it. Transcription is already fully local, the LLM extraction step currently uses a hosted model when online (it runs me about a dollar a day at 24/7), and the next build phase is a GPU box that closes that last gap with a local model.
The feature people are having the most fun with is the airband/ADS-B correlation. The system pulls spoken callsigns out of airband transcripts and matches them to ADS-B tracks by time and geometry, with match windows scaled by altitude and speed, plus hex-to-tail-number derivation. Click a plane on the map and hear what its pilot actually said, with a confidence badge when the match came from a partial readback. Beyond that: an ATAK feed (CoT/KML/GeoJSON), twice-daily AI briefs, a BOLO board, incident threading with a unit activity board, and helicopter orbit detection.
ADS-B aircraft position data automatically linked to airband voice transcripts
Benjamin adds that a public demo is available at https://demo.scannercommand.com. But he notes that "the public demo is a replay of two real days of traffic from my setup".
The software has not yet been released, and it does not appear to be free or open-source. There is a signup waitlist available on the scannercommand.com website.
This is an exciting time with AI not only helping to rapidly develop new software, but now being used to summarize and condense the vast amount of information about the state of the surrounding world available in the RF spectrum.
Scammer Command example mapped incident report
I Turned My Police Scanner Into a Live AI Incident Map (24/7)
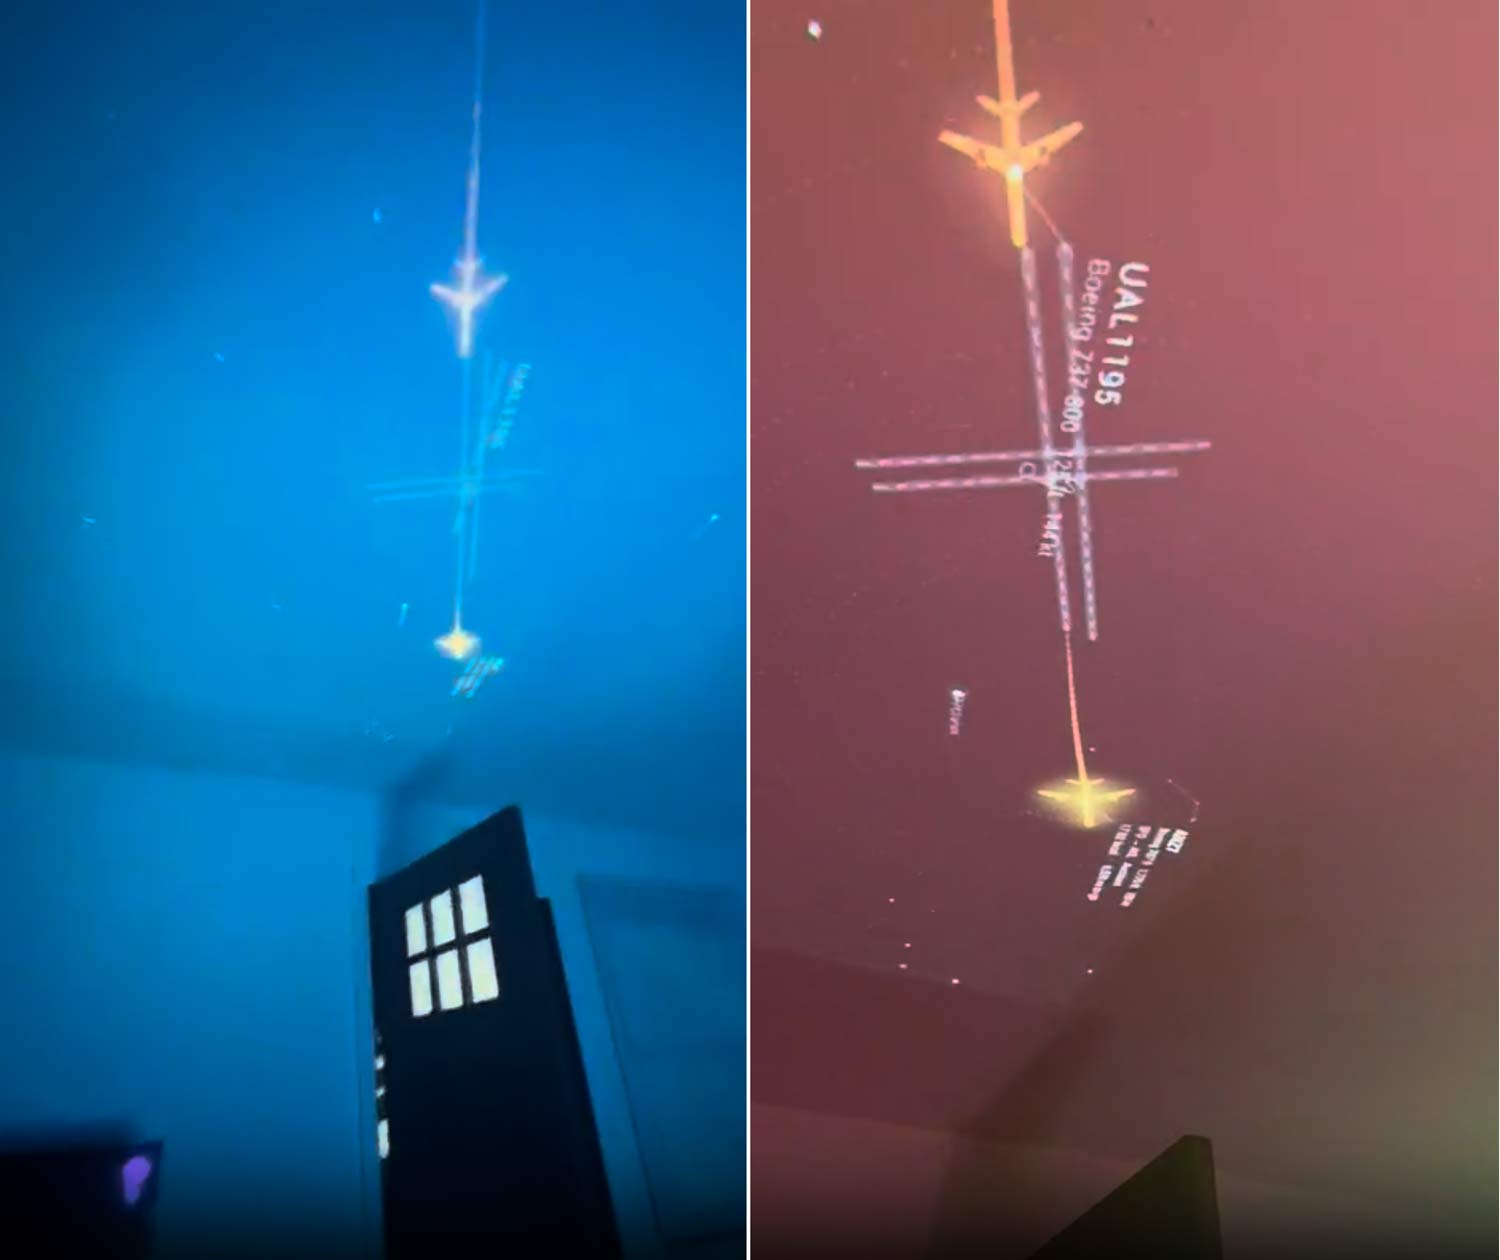
Recently, Cameron Paczek has created a new project called SkyLight, where art meets technical implementation by displaying a live view of aircraft flying overhead on your ceiling. SkyLight consists of a projector, Raspberry Pi 5, RTL-SDR dongle, and some custom software.
The Raspberry Pi 5 and RTL-SDR receive live ADS-B data from local aircraft, and the projector points up at the ceiling and displays the live locations of aircraft as they fly overhead, effectively giving you a simulated X-ray through your roof. The projections also include the sun, moon, bright stars and constellations, and live satellites.
This project reminds us of a British Airways billboard in 2014 that used live ADS-B data to have a child on the screen point directly at incoming aircraft. We note that these SkyLight and billboard projects would not be possible without live ADS-B data, as ADS-B aggregation sites like ADSB-Exchange and Flightradar24 typically have a few-minute delay and require payment for their APIs.
Cameron aims to productize his idea into a ready-made kit and crowd-fund it in the near future. If you are interested, you can sign up for his notification mailing list over at skylightceiling.com.
AI Disclaimer: We note that this project appears to have been coded with the help of AI tools.
Skylight Ceiling Projecting Live Aircraft via ADS-B data on the Ceiling
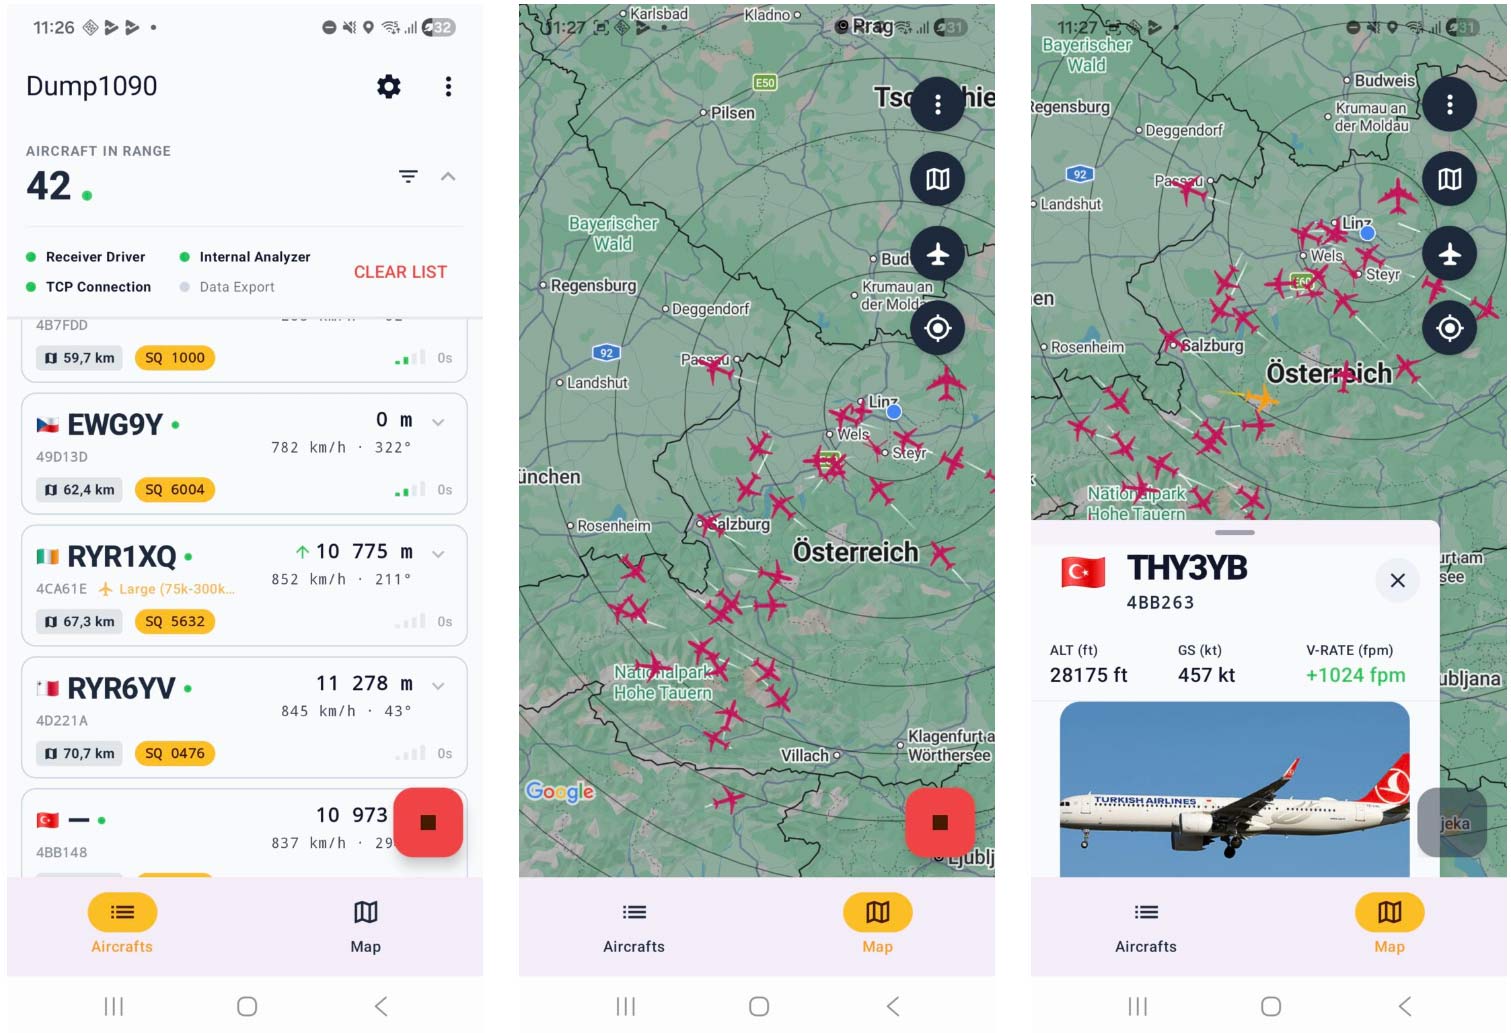
The app allowes users to use an RTL-SDR dongle connected to an Android device to receive ADS-B signals from aircraft and plot their locations on a map. When selecting an aircraft, the app also shows the aircraft's live flight data and a picture of the aircraft.
Over on his blog, Zoltán Papp and team have created an interesting write-up investigating whether Semtech's LR2021, one of the latest LoRa transceiver chips, which draws only 10.4 mA at 3.3V, can be used as a single-chip ADS-B receiver at 1090 MHz. The LR2021 natively supports OOK modulation, and the datasheet even hints at ADS-B reception. Building on prior work, the team captured live ADS-B signals with an SDR and replayed them into the LR2021 eval board for repeatable bench testing.
The initial 3 MHz Rx bandwidth configuration had only a 50% packet success rate with no reception above -50 dBm, because the AGC could not settle within the short 8 us preamble. Extending the sync pattern into the Mode S 'df' field enabled reception across the full dynamic range, but at the trade-off of broadcast message reception only. Manchester decoding and CRC also had to be moved to the host, since, for an unknown reason, Manchester decoding with inverse polarity would not work on the chip.
Measured sensitivity came in about 5 dB shy of the theoretical -89 dBm, with most of the gap blamed on the eval board's front end being matched for 868 MHz rather than 1090 MHz. The team notes that with a modified front end, the theoretical sensitivity should be possible.
With the rise in Raspberry Pi costs due to the consumer memory chip crisis, cheaper ADS-B receiver hardware is welcome. Some existing microcontroller-based ADS-B decoders that we've seen recently include ADSBee and PicoADSB.
Signal Hound SDR Hardware used to Capture and Replay ADS-B For Testing
Over on Kickstarter, Lambda58 LLC has released a campaign for their PicoADSB product, a self-contained 1090 MHz ADS-B receiver that replaces a typical SDR plus Raspberry Pi feeder setup with a single SD-card-sized PCB measuring 25mm x 15mm and weighing only 3 grams. At the time of this post, the campaign has reached around $12,700 against a $10,000 goal, and closes on May 16. The maximum claimed reception range is 500km+. At this time, there is no support for 978 MHz UAT, though they mention staying tuned for updates.
A photo of the board shows that it is based on an ESP32-C3-Mini-1 for the WiFi web server, and on what appears to be a separate microcontroller and an L-band tuner chip. The antenna input is fed via a U.FL connector to a 1090 MHz SAW filter, an LNA, and then the tuner. We suspect that the microcontroller is used for its ADC and for ADS-B demodulation.
PicoADSB appears to compete with ADSBee, which we previously covered. ADSBee is based on the Raspberry Pi Pico chip. However, ADSBee supports both 1090 MHz and 978 MHz on the same board, but costs a little more at US$152 for a set.
The following is a guest post submitted by Matt Larson.
The post explains how Matt Larson set up an automated atmospheric wind-sensing station using only locally obtained ADS-B data from an RTL-SDR. Matt's code is available on GitHub.
Listening to the Jet Stream - 100 Days of Wind Sensing with Stock RTL-SDR Hardware
By Matt Larson — Helena Valley Observatory, Helena, Montana
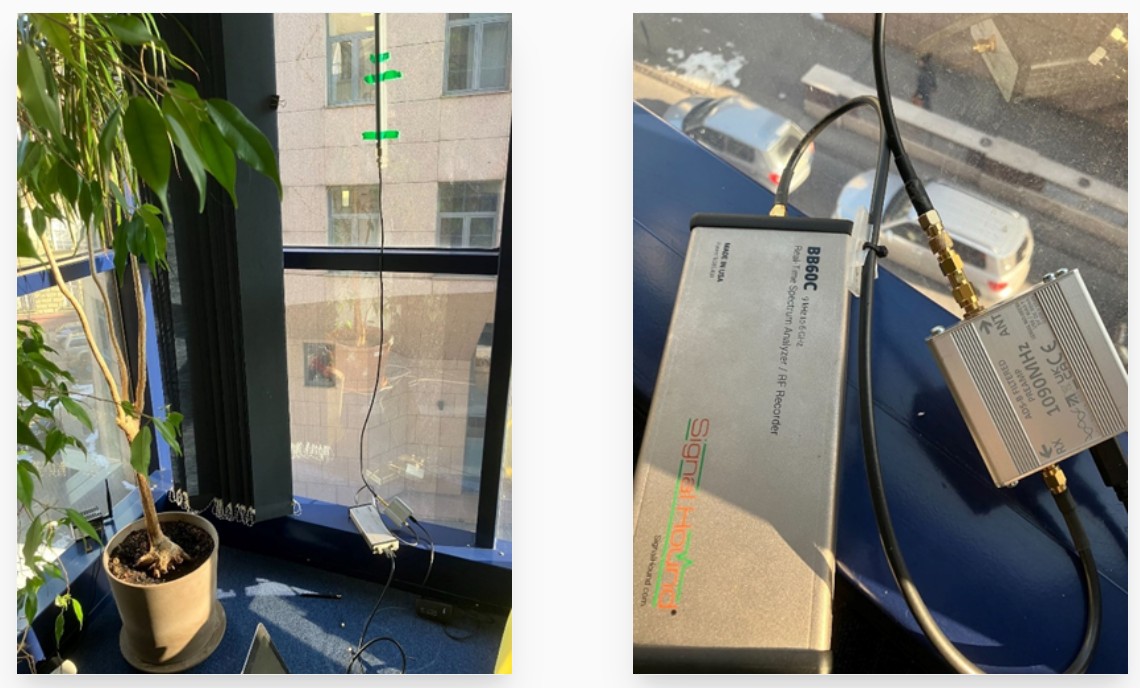
I built a passive atmospheric sensing system using a stock RTL-SDR Blog V4 kit and the included dipole antenna, with no external filtering or amplification.
Over 100 days in Helena, Montana, it logged 5+ million ADS-B messages and produced jet-level wind direction estimates with ~14° mean absolute error versus ERA5 reanalysis on favorable (zonal flow) days — within AMDAR operational reference ranges.
The system requires no aircraft cooperation, no radar, and no onboard meteorological data — only passive reception of ADS-B broadcasts and geometric analysis of reciprocal flight tracks.
This turns an RTL-SDR from a visualization tool into a measurement instrument. Instead of asking "what aircraft are overhead," you can ask "what is the atmosphere doing above me right now?"
The Bet
It started as a $50 bet with myself.
I had no formal background in atmospheric science. No lab, no funding, no institution behind me. Just a house built in 1894 in Helena, Montana, a Linux box, and a question I couldn't stop thinking about: could you use the aircraft already flying overhead as atmospheric sensors — without touching them, without their cooperation, without anything except listening?
The worst case was a $30 receiver and some wasted evenings. The best case was something I couldn't quite articulate yet.
I plugged in an RTL-SDR Blog V4 kit I bought on eBay, pointed the small dipole antenna that came in the kit at the sky, and started asking questions.
That was January 17th, 2026. One hundred days later, I'm writing this with a longitudinal archive of more than 5 million records, validated jet-level wind estimates within the AMDAR operational accuracy range, a documented terrain channeling signature for the Helena Valley, and a surface-level signal consistent with the timing and structure of the January-February 2026 Sudden Stratospheric Warming event, validated against ERA5 and radiosonde data but not independently attributable.
No dedicated 1090MHz antenna. No external filter. No fancy mast. The stock dipole that came in the kit, tuned to 1090MHz.
This is what I learned. And at the end I'll tell you exactly how to start.
What You're Actually Doing
When an aircraft equipped with ADS-B transponds, it broadcasts its GPS position, altitude, groundspeed, heading, and a timestamp. Your RTL-SDR receives that broadcast passively — you're just listening. No radar, no active emissions, no interaction with the aircraft at all.
Most people use this to watch planes on a map. That's genuinely fun. But there's more in that signal than position data.
An aircraft's groundspeed is its speed relative to the ground. Its airspeed is its speed through the air. The difference between those two numbers — the vector difference, accounting for direction — is the wind. The aircraft doesn't measure wind directly, but the relationship between what it's doing through the air and what it's doing over the ground encodes the wind field it's flying through.
The problem is that ADS-B gives you groundspeed, not airspeed. So how do you recover the wind?
The answer is geometry.
If two aircraft fly the same route in opposite directions, one sees a tailwind and one sees a headwind. The difference in their groundspeeds is twice the wind component along that axis. Divide by two, and you recover the wind — without ever measuring airspeed.
No airspeed required. No heading required. Just groundspeed and geometry.
That's the foundation of what I built: a passive atmospheric sensing station that extracts wind information from aircraft that are already flying over my valley every day whether I'm watching or not.
One important note on aircraft types: heavy jets and regional aircraft have different typical true airspeed values at the same altitude. The solver accounts for aircraft class when making TAS assumptions, and estimates are validated against external reanalysis data rather than treated as precise measurements in isolation.
The Observatory
The hardware is simple.
RTL-SDR Blog V4 kit from eBay. The small dipole that comes in the kit. Tuned to 1090MHz. A Linux machine running Arch. readsb decoding the signal. A Python pipeline I wrote from scratch to archive, segment, and analyze the data.
That's the whole stack. No proprietary software. No cloud dependencies. No subscription. Everything runs locally and everything is mine.
The software architecture has three layers.
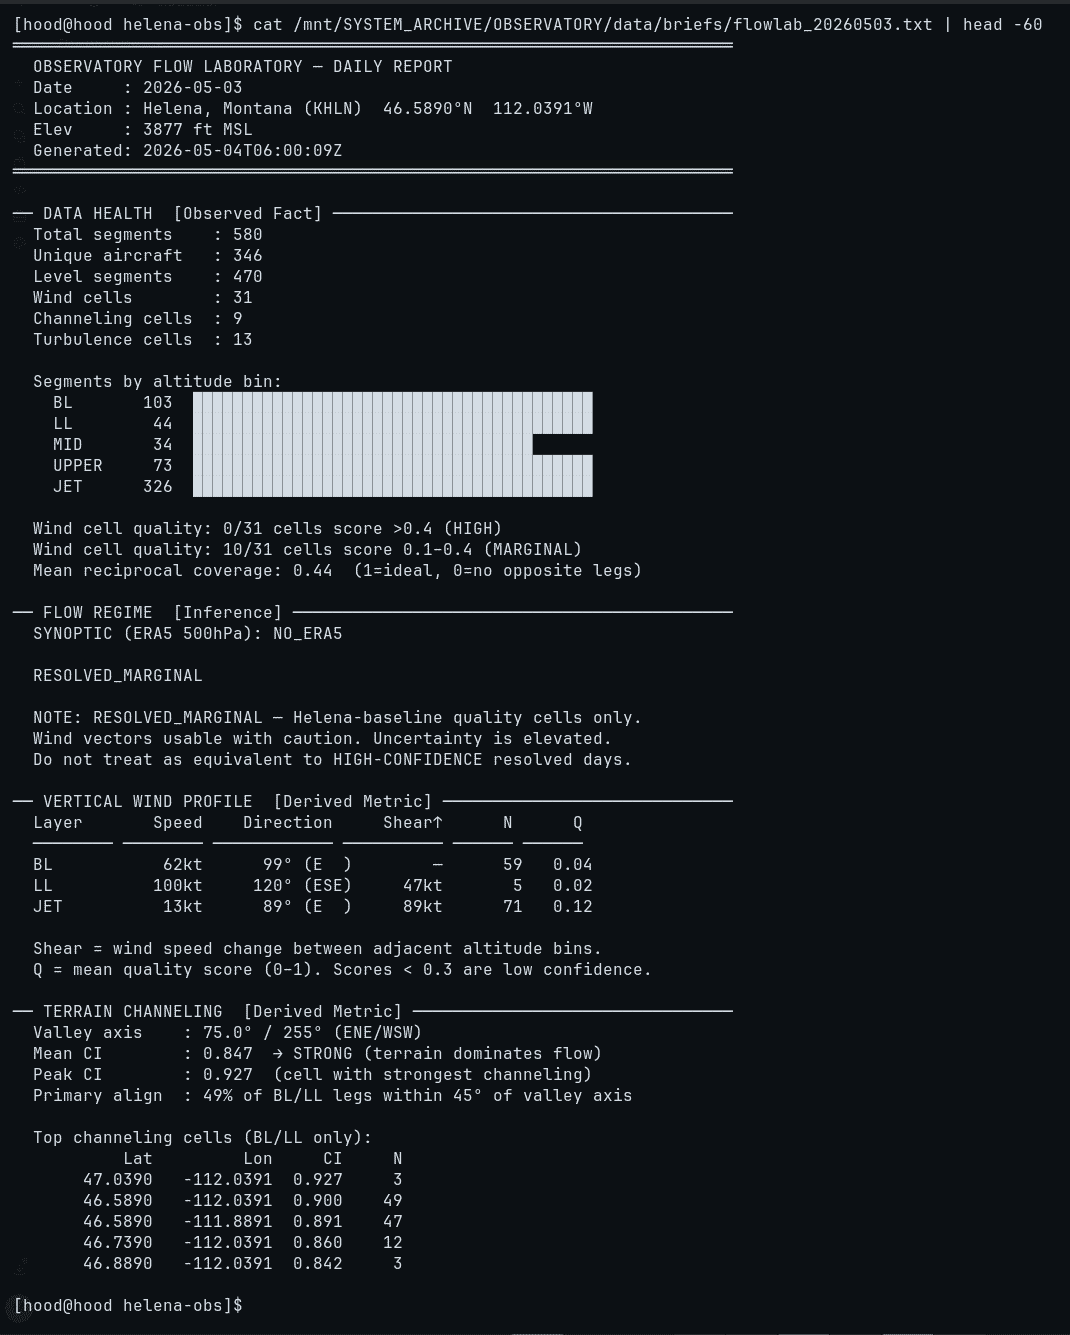
The first is the archive. Every observation logged to JSONL files — position, altitude, groundspeed, callsign, registration, timestamp — every five seconds, continuously, without gaps. After 100 days that archive contains more than 5 million records representing roughly 300 unique aircraft per day.
The second is the Flow Lab. The atmospheric analysis pipeline. It runs four stages each night: segmentation breaks continuous aircraft tracks into straight-line level-flight segments; wind solving applies the reciprocal pair geometry to extract wind vectors per altitude layer; terrain analysis measures how strongly the valley's topography constrains aircraft tracks; and reporting produces a daily brief in plain text that I read the next morning like a weather report from my own kitchen.
The third is the Signal Lab. RF characterization — near-field and far-field RSSI variance, anomalous propagation events, terrain shadow mapping, free-space path loss residuals. The radio environment of the Helena Valley, documented day by day.
Everything automated. Everything archived. Every output reproducible from the raw JSONL files.
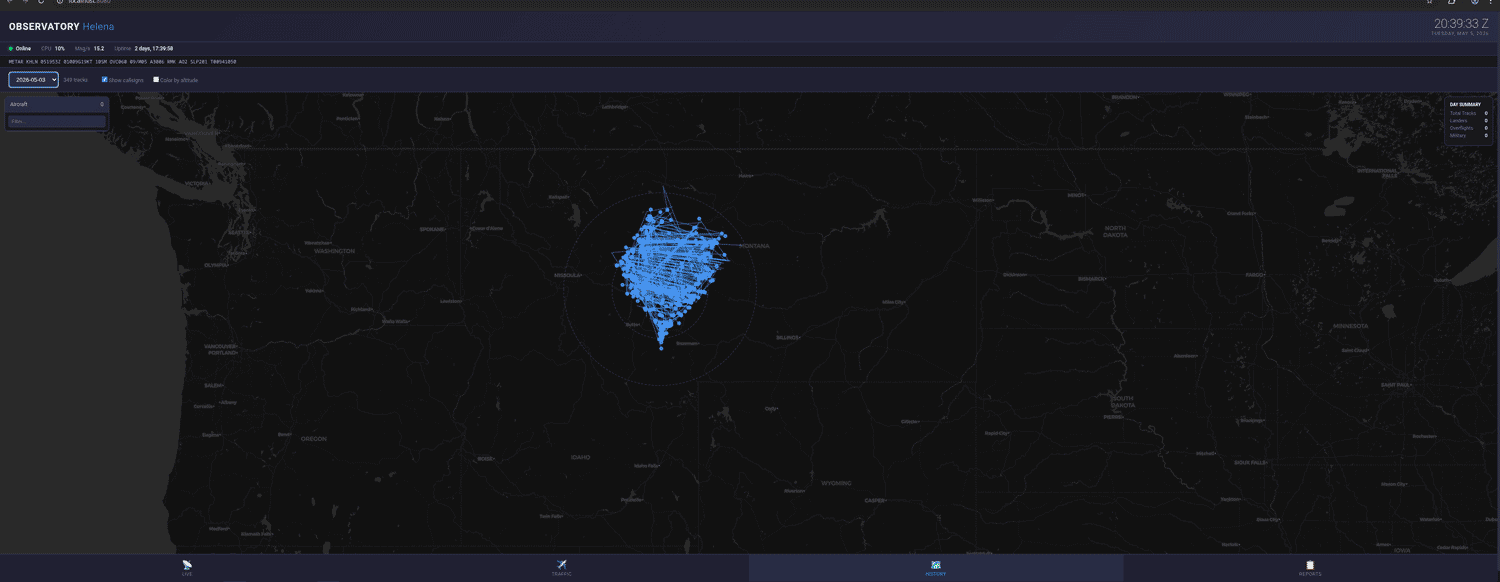
ADS-B Tracks Received by the ObservatorySample daily brief output from the Flow Lab pipeline
What the Methodology Requires — And What It Doesn't
I want to be honest about what this system can and cannot do before I tell you what it found, because the limitations matter as much as the results.
The reciprocal pair wind solver works under specific conditions. It needs enough aircraft flying opposing tracks at similar times and similar altitudes. On busy traffic days with good reciprocal coverage it produces clean wind estimates. On quiet days or days with limited crossing geometry it produces nothing — and says so explicitly rather than guessing.
Wind direction is recoverable with reasonable accuracy under these conditions. Wind speed carries inherent uncertainty because the solver depends on assumptions about aircraft true airspeed. Speed estimates are reported with explicit uncertainty bands and are not treated as precise measurements.
The system fails gracefully on trough days — when the jet stream is curved and the flow is complex. On those days the solver flags the output as UNRESOLVED and produces no wind estimate rather than a wrong one. Knowing when you cannot measure something is part of measuring it honestly.
Every output in the daily brief carries a label: OBSERVED FACT, DERIVED METRIC, or INFERENCE. Nothing gets promoted to a finding without meeting explicit quality gates. The methodology is documented in enough detail that anyone could replicate it and get comparable results.
What 100 Days Found
Jet-level wind direction.
The reciprocal pair solver produces daily wind direction estimates at five altitude layers. At the jet stream layer — above 36,000 feet — the day-to-day directional consistency across the archive shows a correlation of R=0.954. That's a strong unimodal signal. The jet over Helena runs westerly the vast majority of days, with documented exceptions on trough and transition days.
On days with zonal flow — when the atmosphere is well-organized and the jet is running straight — I compared estimates against ERA5 reanalysis data from the Copernicus Climate Data Store. Here are the actual numbers:
Metric
Value
ZONAL days with ERA5 comparison
N=21
Mean angular error (MAE)
14.3°
Median angular error
13.5°
Best day
0.3° error
Worst day
38.3° error
Days with STABLE solution (robust to parameter changes)
68 of 81 (84%)
Day-to-day jet direction consistency (R)
0.954
AMDAR operational target range
10–20°
A $30 kit with a stock dipole antenna on a rooftop in Montana is producing estimates that land inside the AMDAR operational accuracy range on favorable days. On trough days the system fails and says so. That's also a result.
Terrain channeling.
The Helena Valley runs roughly ENE/WSW — 75 degrees and 255 degrees. The terrain channeling index measures what fraction of low-altitude aircraft tracks align within 45 degrees of that axis.
The mean channeling index across 100 days is 0.855.
To put that plainly: the valley's terrain is so effective at constraining low-level airflow that it dominates aircraft track orientation regardless of what the synoptic weather pattern is doing that day. Aircraft aren't intentionally following the valley — their routes are set by ATC. But the wind field the terrain creates pushes their ground tracks toward the valley axis. The terrain writes its signature into the aviation data every single day, zonal or trough, January or May.
That signal is geographically structured. The channeling index is strongest in the valley core — CI above 0.90 near the center of the Prickly Pear Valley. It weakens at the eastern exits where the terrain opens toward the Missouri River drainage and the Elkhorn foothills. The valley acts like a funnel: strong forcing at the narrow western end, diminishing constraint as the terrain opens to the east. The passive observer mapped that transition without anyone telling it where to look.
Atmospheric events.
The 100-day archive contains 43 documented atmospheric events: 21 split-column events where the boundary layer and upper atmosphere were moving in opposite directions, 11 shear events with elevated mid-level turbulence signatures, 3 probable mid-level shear zones independently verified against IGRA2 radiosonde data, and 2 rough days with elevated boundary layer turbulence indices.
The March 8th event is the clearest example. The system flagged elevated turbulence at both the boundary layer and mid level simultaneously — boundary layer kinematic turbulence index 12.1 knots, mid level index 19.6 knots. IGRA2 radiosonde data confirmed a low-level jet developing through the day with 52 degrees of directional shear within the boundary layer and speed shear at the boundary layer to mid level interface. The passive observer detected the event. Independent radiosonde data confirmed the mechanism.
A surface signal consistent with the Sudden Stratospheric Warming.
In early February 2026 a major Sudden Stratospheric Warming event occurred — the polar vortex split into two lobes around February 15th, confirmed by NOAA and multiple meteorological agencies. The observatory was running continuously through this entire period.
The archive shows what happened from the ground up. In late January the jet stream over Helena was running at an estimated 88 knots westerly — consistent with the pre-SSW pattern. In mid-February the system flagged a dramatic collapse: a 73% drop in the jet proxy falling to roughly 24 knots. February 18th through 22nd showed persistent Signal Lab anomalies with anomalous propagation events clustering to the SSE. February 23rd through 25th produced two PROBABLE mid-level turbulence events verified by radiosonde — mid-level shear zones consistent with a disorganized recovering jet. February 24th was the archive's strongest validated day: four independent internal proxies converging on a jet estimate of 139 knots, confirmed against ERA5 data.
To be precise about what this means: the observatory measures aircraft groundspeed residuals — it does not measure the stratosphere directly. The archive cannot independently confirm the SSW as the cause. What it can confirm is that a surface-level signal consistent with the timing and structure of a major SSW was real, measurable, and validated against ERA5 and radiosonde data. The passive observer caught it. The independent data confirmed the structure.
A $30 kit with a stock dipole, in a kitchen, in Helena Montana.
What Happened When I Went Outside
At about day 60 I started showing the work to people.
I walked into a flight school near KHLN airport. Introduced myself, explained what I'd been building. The owner sat with me for 45 minutes. He gave me an aviation weather handbook. That conversation — a working pilot engaging seriously with what a passive ground station was measuring — told me the methodology was asking the right questions even if I didn't have all the answers yet.
I sent a cold email to an atmospheric scientist. Dr. de Haan — who I later discovered is considered the godfather of this type of science — was working in a similar space but with a more direct approach. His methodology reads meteorological data from Mode-S transponder messages directly. Mine derives it from geometry. I found out he existed after I'd already built my own approach from scratch, which was a relief — it meant I wasn't crazy, just doing it the hard way. He replied that he would review the methodology. I'm still waiting. That's honest. The door is open.
Then something unexpected happened. In a Facebook group where I'd been sharing the work, a United States Air Force F-16 pilot read what I was doing and reached out. He had one question and two comments about the wind estimation methodology — questioning the TAS assumption across aircraft types, pushing back on the turbulence classification, and suggesting vertical velocity indicators as a potentially cleaner turbulence signal than groundspeed.
He wasn't wrong on any of it. The methodology got better.
An F-16 pilot giving aerodynamic feedback to a guy with a stock dipole antenna and a Linux box in Helena Montana. Under 90 days in.
I'm telling you this not to impress but because it matters for what the approach can become. These are people who would recognize if the methodology was nonsense. They engaged because the work was honest. The outputs were constrained within what the data could actually support. The failure modes were documented. The limitations were stated.
Honest work finds its audience.
The Bigger Picture
I want to say something carefully about what this could mean beyond my valley.
The Helena Valley Observatory is one station. One fixed location. One passive receiver. Its findings describe the atmosphere above a specific valley at a specific elevation between specific mountain ranges. They do not generalize without replication.
But the methodology generalizes. Anywhere aircraft fly, the reciprocal pair geometry works. The Flow Lab pipeline is documented and reproducible. The hardware is a $30 kit with a stock antenna and a Linux machine.
There are regions of the world with almost no upper-air atmospheric data — no radiosondes, no AMDAR coverage, no radar. Some of those regions have commercial aviation flying overhead every day. The aircraft are already doing the work. Someone just needs to listen.
I'm not claiming the Helena system is ready for operational use. The methodology needs more validation, more external review, more replication at other sites. The failure modes need to be fully characterized before anyone trusts the outputs for anything beyond research.
But the proof of concept exists. One person, one 1894 house, one $30 kit with a stock dipole antenna, and 100 days of honest science. Wind estimates inside the AMDAR accuracy range. A terrain channeling signature consistent with the physical geography. A surface signal consistent with a major stratospheric event, confirmed by independent data.
The floor of what's possible with this approach is higher than I expected when I made the bet.
How to Start
Minimum setup:
RTL-SDR Blog V4 kit
Stock dipole antenna (tuned to 1090MHz)
readsb for decoding
JSON logging at 5-second intervals
A Linux machine with ~50MB/day storage
30-day baseline:
200–300 aircraft per day depending on your location
Reciprocal track pairs accumulate naturally with traffic
Wind inference becomes possible on high-traffic days
Don't build the analysis pipeline yet — let the archive grow first
Validation (don't skip this):
ERA5 reanalysis — freely available from the Copernicus Climate Data Store
IGRA2 radiosonde data — nearest upper-air station to your location
The data has to be accountable to something outside itself
The honest timeline:
The methodology I built took 100 days to stabilize. The first version of the wind solver produced plausible-looking results that turned out to be wrong in ways I couldn't detect without external validation. ERA5 and IGRA2 cross-checking revealed failure modes I didn't know existed. The system got better by failing honestly and documenting the failures.
Every location is different. Every valley has different terrain, different traffic patterns, different failure modes. The Helena findings don't transfer to your site without your own 100 days.
Start simple. Log everything. Stay honest about what you know and what you don't. Let the archive earn its findings.
The aircraft are already up there. They've been flying over your house for decades. All you're doing is listening.
Carl Laufer and the RTL-SDR.com community — for building hardware worth building with, and for creating a platform where people share what they learn.
The atmospheric science community for making ERA5 and IGRA2 data publicly available. Cross-validation against real data is what separates science from wishful thinking.
Dr. de Haan for being willing to look at the work. The flight school owner in Helena who gave me the Aviation Weather handbook and 45 minutes of honest conversation. The F-16 pilot who read what I was doing in a Facebook group and sent feedback that made the methodology better.
And the aircraft. The thousands of pilots who fly over the Helena Valley every day without knowing someone in a 132-year-old house is listening.
Matt Larson Helena Valley Observatory Helena, Montana May 2026
The observatory runs on curiosity, Linux, and a $30 bet that turned out to be worth taking.
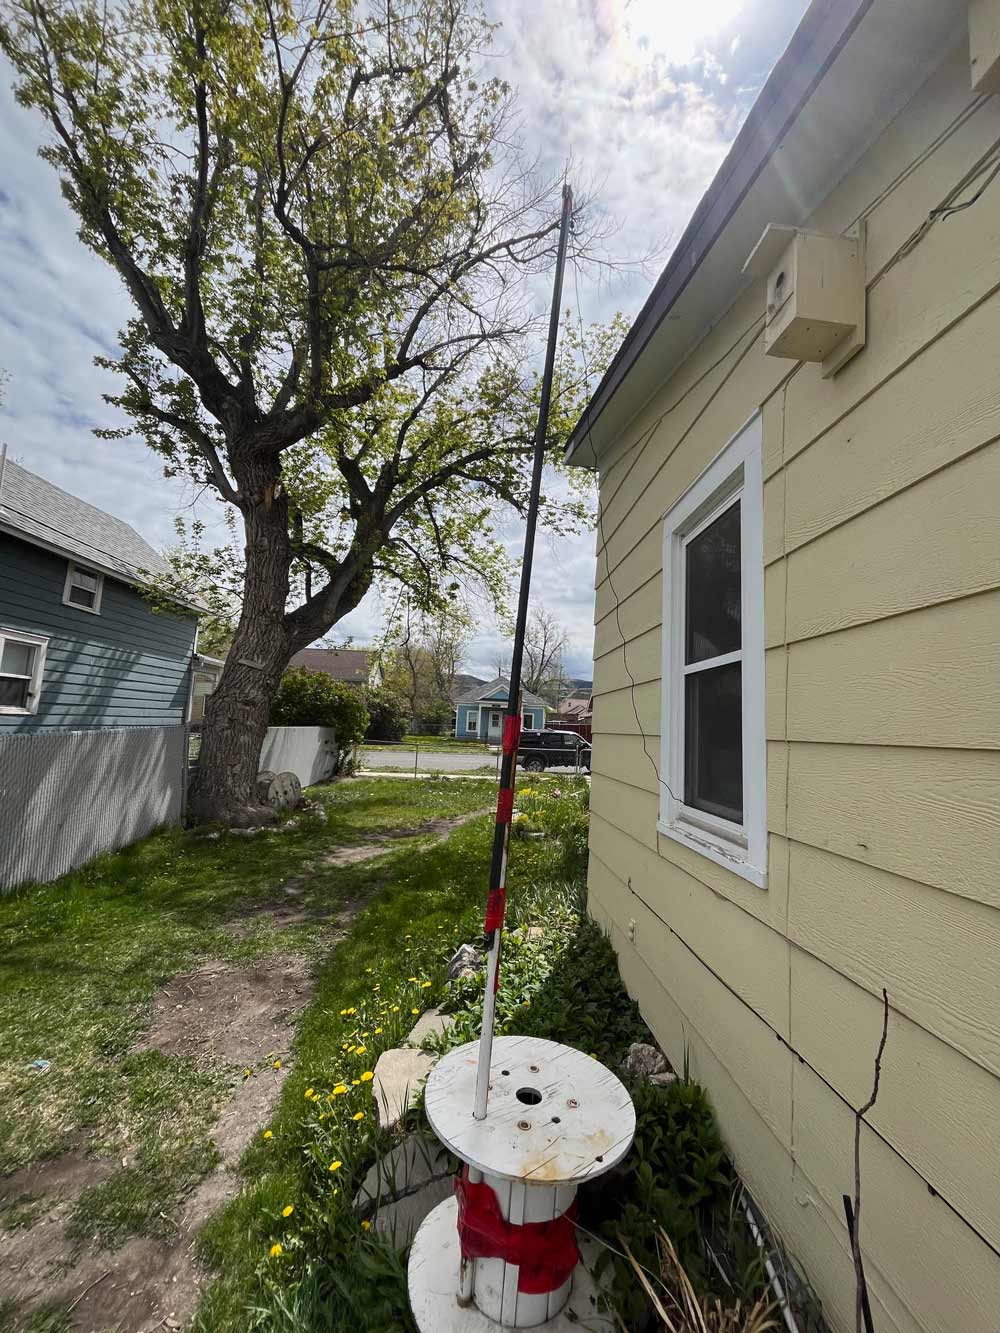
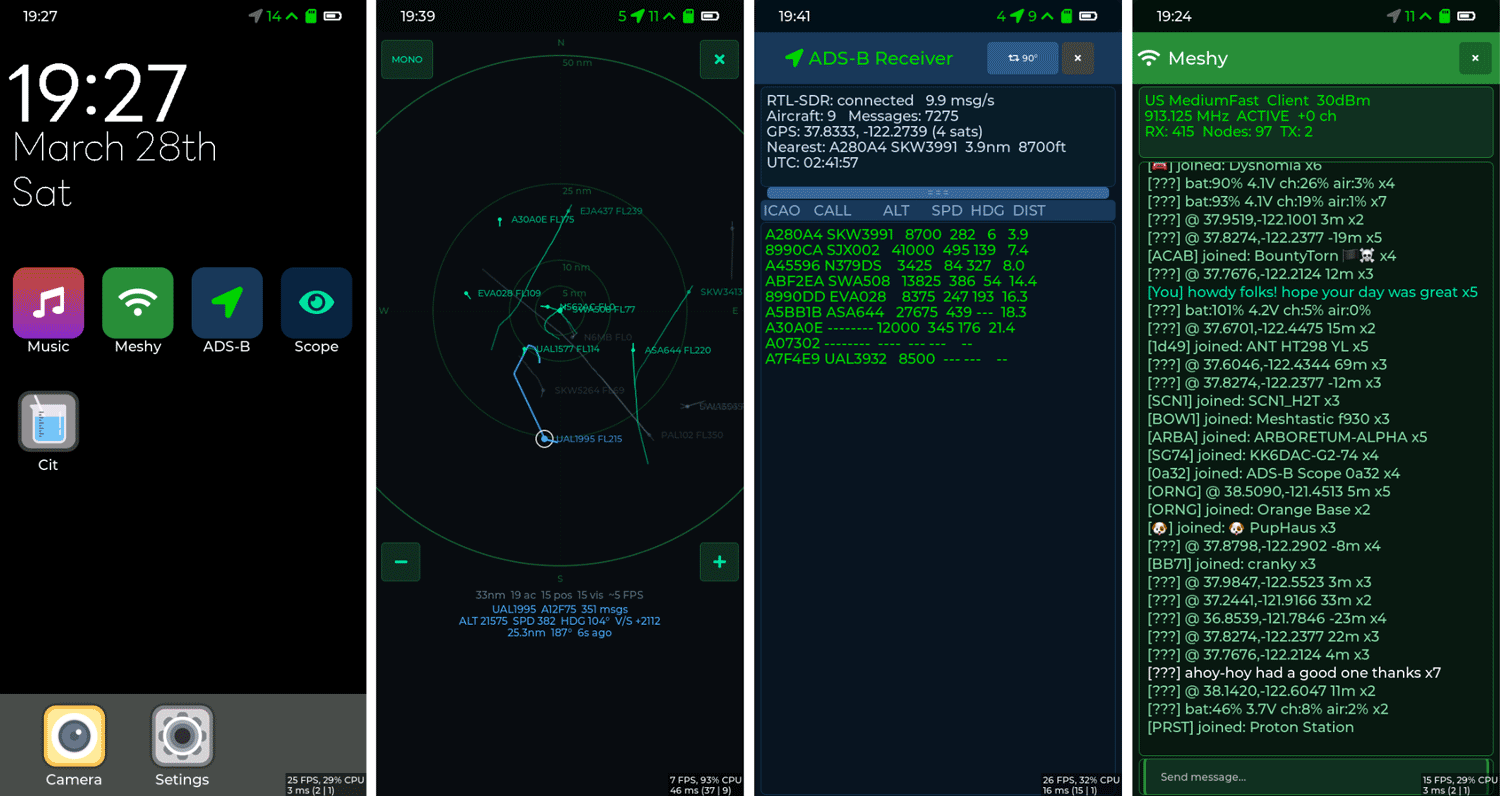
Over on GitHub, John Stockdale has released ADS-B Scope – T-Display-P4, a portable open source 1090 MHz ADS-B firmware for the LILYGO T-Display-P4, which is a smartphone-shaped handheld microcontroller with a 4" touchscreen, GPS, SD card, SX1262 LoRa, and a USB 2.0 host port, built around the dual-core 360 MHz RISC-V ESP32-P4.
The most interesting bit is that John has written a custom USB host driver that allows an RTL-SDR to plug directly into the T-Display-P4. Neither a Pi nor a laptop is needed in the chain. The driver supports the Blog V4/V3 with software bias-tee control and Mode-S demodulation (adapted from dump1090), which runs in real time alongside an on-device aircraft table and radar scope (range rings, trails, helicopter silhouettes). The firmware also implements adaptive gain control, a 587K-record OpenSky aircraft database cached in PSRAM, SD card CSV logging, USB hot-plug, OTA updates, MQTT telemetry, and a WebSerial companion app at adsb-scope.offx1.com with live map, 3D view, CSV replay, and firmware flashing.
In addition to all that, the firmware also runs a Meshtastic-compatible mesh radio on the SX1262 (with PKI DM decryption and MQTT gateway forwarding) and an MP3 player through the onboard ES8311 DAC. John reports ~30 nm range from Oakland, CA on a 7" telescopic antenna, decoding 15–30 messages per second with 12–30+ aircraft tracked.
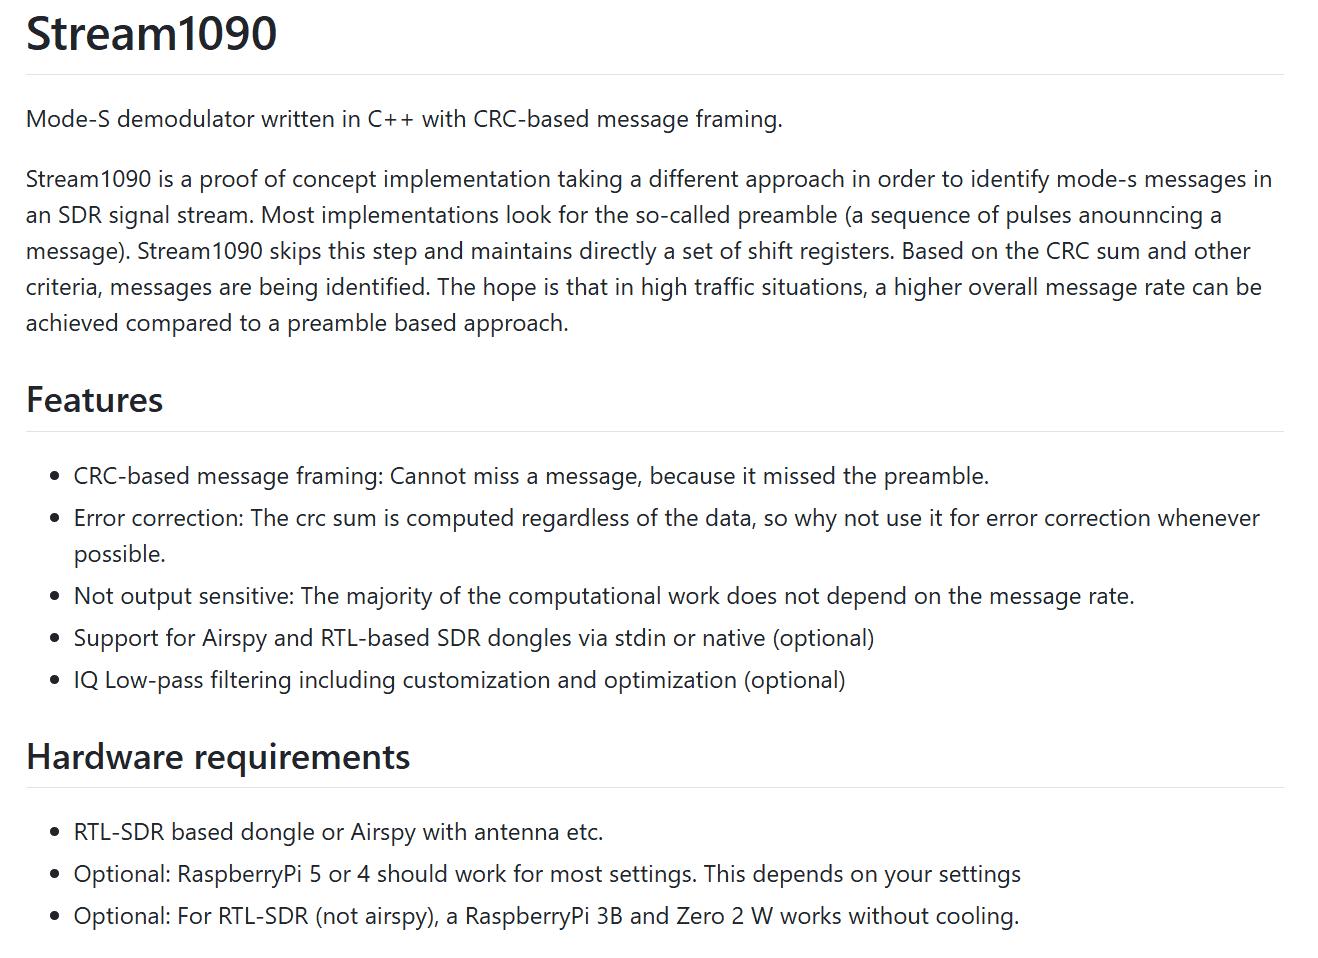
Over on GitHub, Martin (mgrone) recently released stream1090, a new open source C++ Mode-S demodulator that takes a fundamentally different approach to finding aircraft messages. Rather than searching for the traditional preamble pulse sequence as dump1090 and readsb do, stream1090 continuously maintains shift registers and identifies valid messages based on their CRC checksum. In busy airspace where preambles can be corrupted by overlapping signals, this approach theoretically cannot miss a message as long as the data itself is intact. Since the CRC is always being computed, it can also be used for single-bit error correction.
The software supports both RTL-SDR and Airspy dongles. It's lightweight enough to run on a Raspberry Pi Zero 2W. Stream1090 is a demodulator only, designed to pipe output into readsb or dump1090-fa via socat, slotting into your existing ADS-B stack as a drop-in replacement for the demodulation stage.
If you have an ADS-B station in a high-traffic area, let us know if Stream1090 increases your message rate! There is also a discussion about it on FlightAware, where many people have indicated that they are getting great results.