Visualizing the electromagnetic spectrum with Frequensea and an RTL-SDR
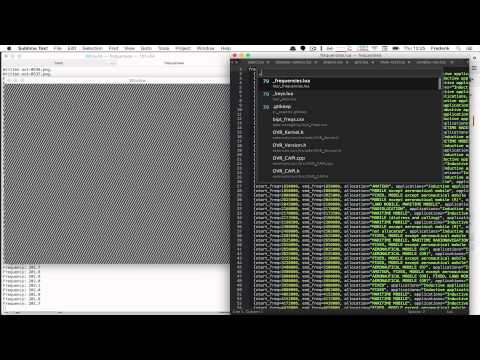
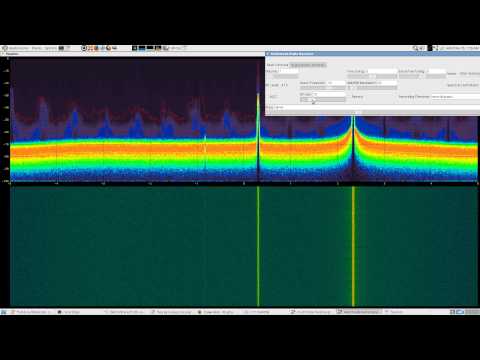
Over on YouTube user Frederik De Bleser has uploaded a video showing his new open source toolkit called Frequensea which can be used for visualizing the electromagnetic spectrum with an RTL-SDR or HackRF. The software allows you to visualize the output as an FFT spectrum in various 3D display modes and is even compatible with the Oculus Rift, a virtual reality headset.
Frequensea can be downloaded from https://github.com/fdb/frequensea, and it currently has installation instructions available for OSX, Ubuntu and the Raspberry Pi.