Cheap and Easy Hydrogen Line Radio Astronomy with an RTL-SDR, WiFi Parabolic Grid Dish, LNA and SDRSharp
We've recently been testing methods to help budding amateur radio astronomers get into the hobby cheaply and easily. We have found that a low cost 2.4 GHz 100 cm x 60 cm parabolic WiFi grid antenna, combined with an RTL-SDR and LNA is sufficient to detect the hydrogen line peak and doppler shifts of the galactic plane. This means that you can create backyard hydrogen line radio telescope for less than US$200, with no complicated construction required.
If you don't know what the hydrogen line is, we'll explain it here. Hydrogen atoms randomly emit photons at a wavelength of 21cm (1420.4058 MHz). Normally a single hydrogen atom will only very rarely emit a photon, but the galaxy and even empty space is filled with many hydrogen atoms, so the average effect is an observable RF power spike at ~1420.4058 MHz. By pointing a radio telescope at the night sky and averaging the RF power over time, a power spike indicating the hydrogen line can be observed in a frequency spectrum plot. This can be used for some interesting experiments, for example you could measure the size and shape of our galaxy. Thicker areas of the galaxy will have more hydrogen and thus a larger spike, whereas the spike will be significantly smaller when pointing at empty space. You can also measure the rotational speed of our galaxy by noting the frequency doppler shift.
The 2.4 GHz parabolic WiFi grid dishes can be found for a cheap at US$49.99 on eBay and for around US$75 on Amazon. Outside of the USA they are typically carried by local wireless communications stores or the local eBay/Amazon equivalent. If you're buying one, be sure to get the 2.4 GHz version and NOT the 5 GHz version. If you can find 1.9 GHz parabolic grid dish, then this is also a good choice. Although we haven't tested it, this larger 2.4 GHz grid dish would probably also work and give slightly better results. WiFi grid antennas have been commonly used for GOES and GK-2A geosynchronous weather satellite reception at 2.4 GHz with RTL-SDRs as well and we have a tutorial on that available on our previous post.
[2025 Update: With post-COVID inflation, the prices of these dishes are quite a bit higher now. You might also want to consider our new Discovery Dish product, which is a dish + 1.42 GHz feed + filter + LNA all in one.]
These dishes are linearly polarized but that is okay as hydrogen line emissions are randomly polarized. Ideally we would have a dual polarization (NOT circular polarized) feed, but linear appears to be enough and is much simpler. In addition, the 2.4 GHz feed is obviously not designed for 1420 MHz, but just like with GOES at 1.7 GHz the SWR is low enough that it still works.
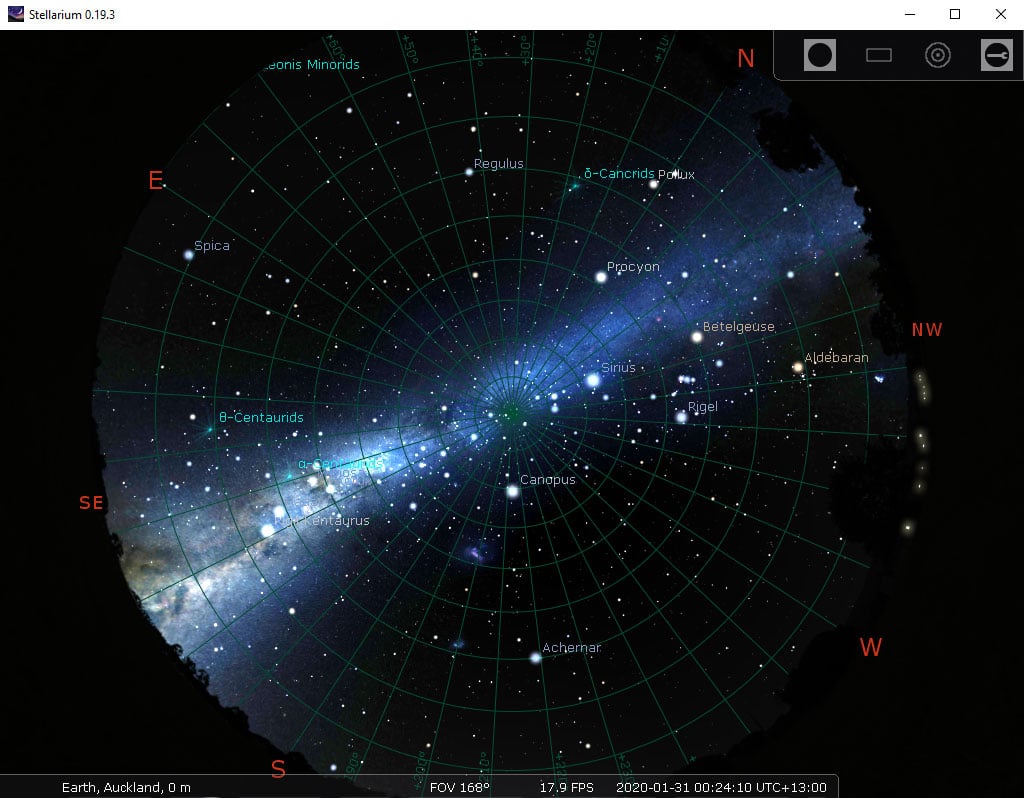
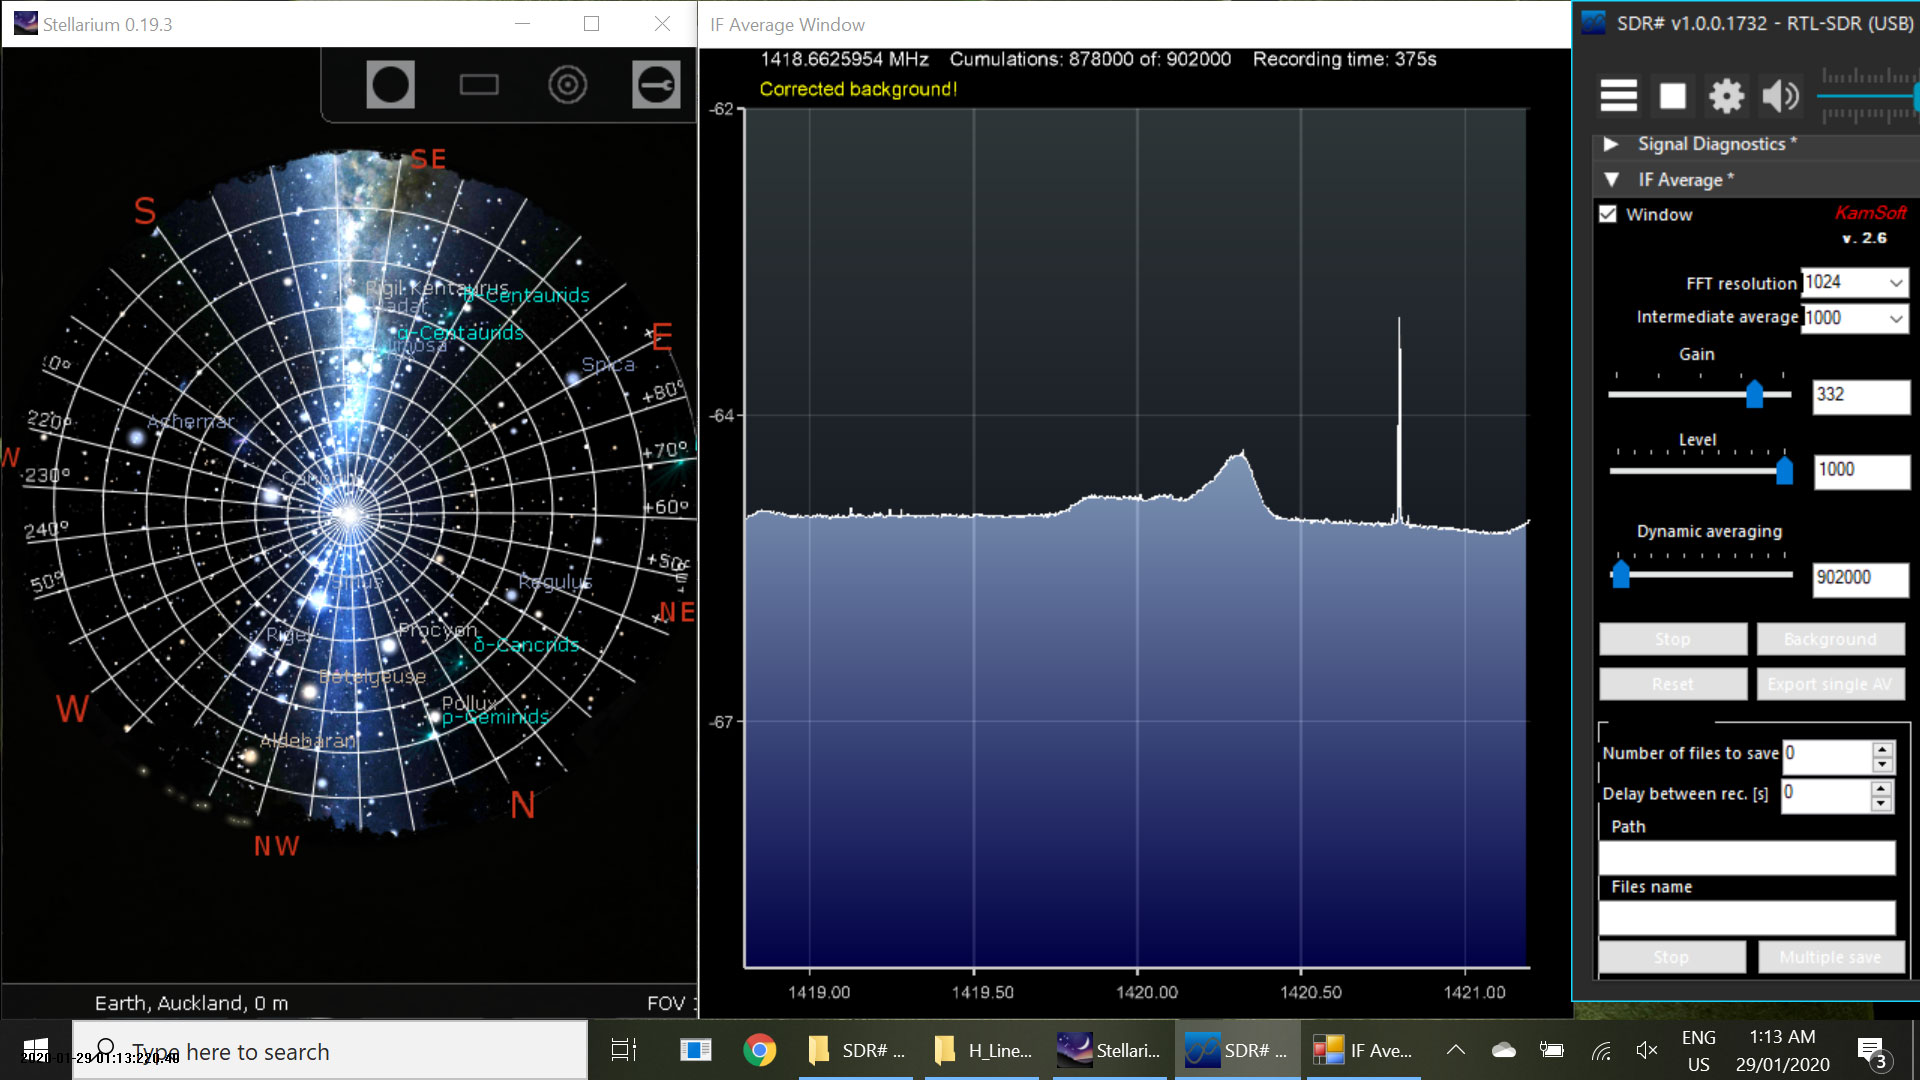
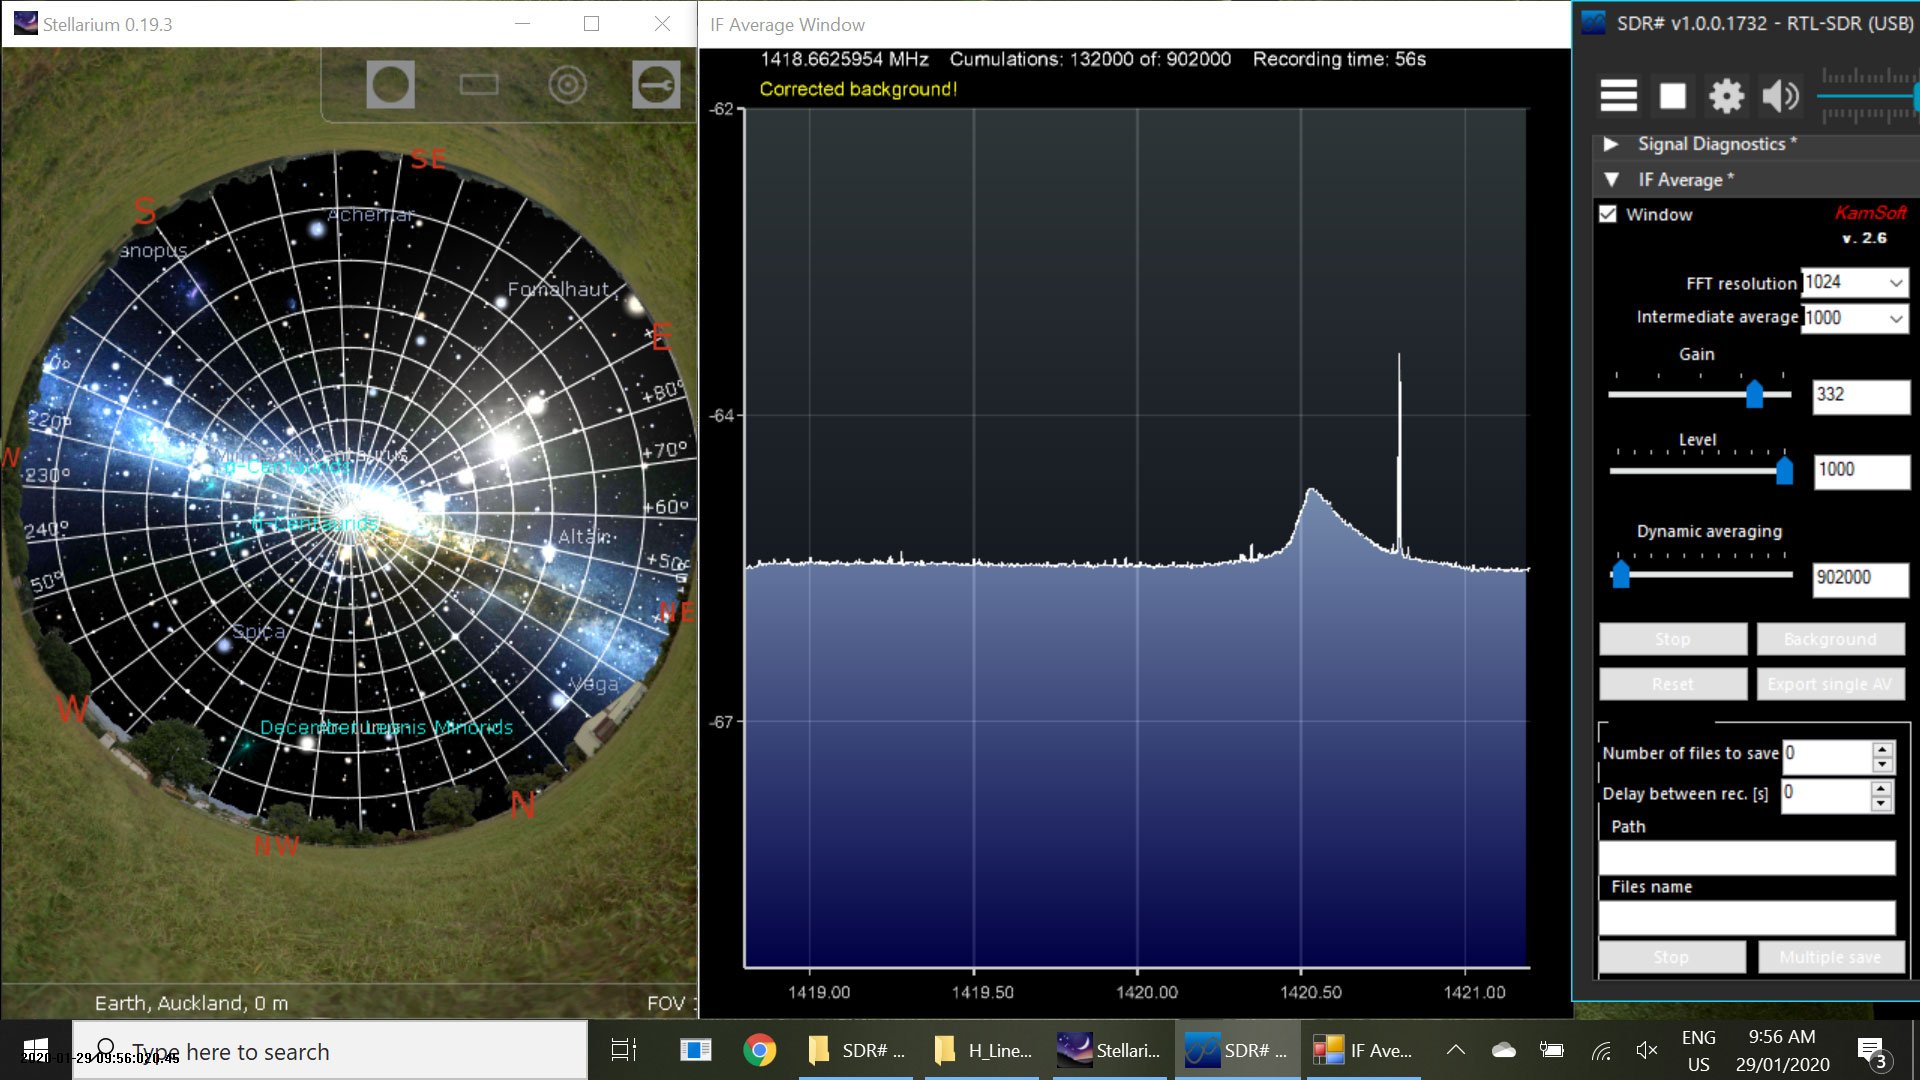
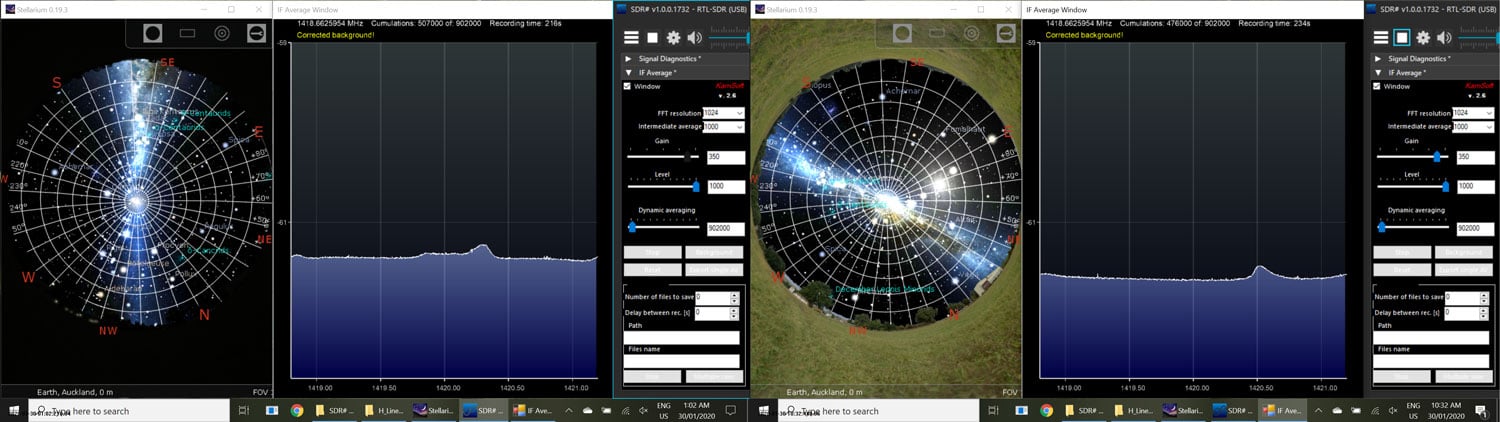
The animation below shows a hydrogen line "drift" scan performed with the 2.4 GHz WiFi dish, an RTL-SDR Blog V3 and a NooElec SAWBird H1 LNA. The scan is performed over one day, and we simply let the rotation of the earth allow the Milky Way to drift over the antenna. The Stellarium software on the left shows the movement of the Milky Way/galactic plane over the course of a day for our location. The dish antenna points straight up into the sky, and we have set Stellarium to look straight up too, so Stellarium sees exactly what our dish antenna is seeing.
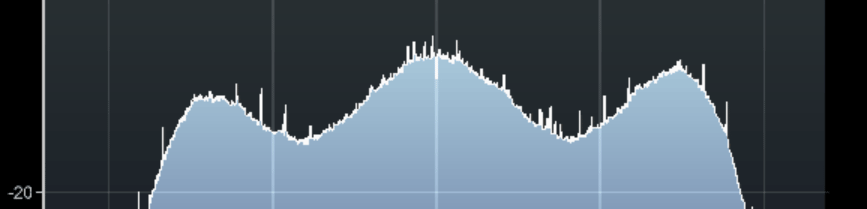
You can clearly see that there is a lump in the radio spectrum at around 1420.40 MHz that grows when parts of the Milky Way pass over the antenna. This lump is the hydrogen line being detected. As our Milky Way galaxy is filled with significantly more hydrogen than empty space, we see a larger lump when the antenna points at the Milky Way, and only a very small lump when it points away.
It's important to ignore the very narrowband spikes in the spectrum. These narrowband spikes are simply radio interference from electronics from neighbors - probably TVs or monitors as we note that most of the interference occurs during the day. There is also a large constant spike which appears to be an artifact of the LNA. The LNA we used has a 1420 MHz filter built in, but LCD TVs and other electronics in today's suburban environment spew noise all across the spectrum, even at 1420 MHz.
You can also note that the hydrogen line peak is moving around in frequency as different parts of the galaxy pass overhead. This indicates the doppler shift of the part of the galaxy being observed. Because the arms of the galaxy and the hydrogen in it is rotating at significant speeds, the frequency is doppler shifted relative to us.
Using the power and doppler shift data of the hydrogen line is how astronomers first determined the properties of our galaxy like shape, size and rotational speed. If we continued to scan the sky over a few months, we could eventually build up a full map of our galaxy, like what CCERA have done as explained in this previous post.
Hardware Required
[2025 Update: With post-COVID inflation, the prices of these products are quite a bit higher now. You might also want to consider our new Discovery Dish product, which is a dish + 1.42 GHz feed + filter + LNA all in one.]
- A 2.4 GHz WiFi parabolic grid dish. (~$50)
- A low noise amplifier (LNA). This is required to get the noise figure of the receiving system low enough, and the gain high enough.
- We recommend using a hydrogen line specific LNA. Good models include the NooElec SAWBird+ H1 ($44.95), or the GPIO labs Hydrogen Line pre-filtered LNA ($49.95).
Using a specially made hydrogen line LNA with filtering built in will get you better results compared to a general purpose wideband LNA. It may also be mandatory to use one of these LNAs for those living in areas with strong interfering signals from things like cellular and broadcast FM/TV etc.
- If you're on a budget, and don't have many strong interfering signals around you, then you get away with using an unfiltered general purpose wideband LNA like an LNA4ALL or our $19 RTL-SDR Blog wideband LNA.
We can generally get away with an unfiltered LNA if we point the antenna straight up towards the sky, or at a high elevation. This avoids most terrestrial sources of noise from leaking into the antenna. However, the H-Line specific LNAs are usually very high gain, and very low noise figure, so can work better for this type of experiment.
- We recommend using a hydrogen line specific LNA. Good models include the NooElec SAWBird+ H1 ($44.95), or the GPIO labs Hydrogen Line pre-filtered LNA ($49.95).
- An RTL-SDR Blog V3, or any other RTL-SDR with a built in bias tee (~$21.95). An Airspy is also a good choice with good supporting software, but costs a lot more.
- A Type N Male to SMA Male adapter (~$7 on Amazon, cheaper elsewhere). Most WiFi grid antennas have an N-female connector so we need to convert to SMA to connect to the RTL-SDR.
- A high quality USB extension cable (~$10), just long enough to get to your PC/laptop. We recommend a high quality USB3.0 spec cable, as these have much lower voltage loss over longer runs. If you're using an active cable, make sure it can handle the voltage drop.
- Some sort of tripod ($39.99) to mount your dish, or another way to mount it. You could probably even just lay it on the ground.
- A 50 Ohm terminator ($5.50) (optional but recommended)
- A Windows PC or Laptop (for this tutorial). A Raspberry Pi could also work with other software or as a TCP server.
Total cost (not including the PC): US$179.40, and probably less if you already have some parts or find similar items priced cheaper elsewhere.
Hardware Setup
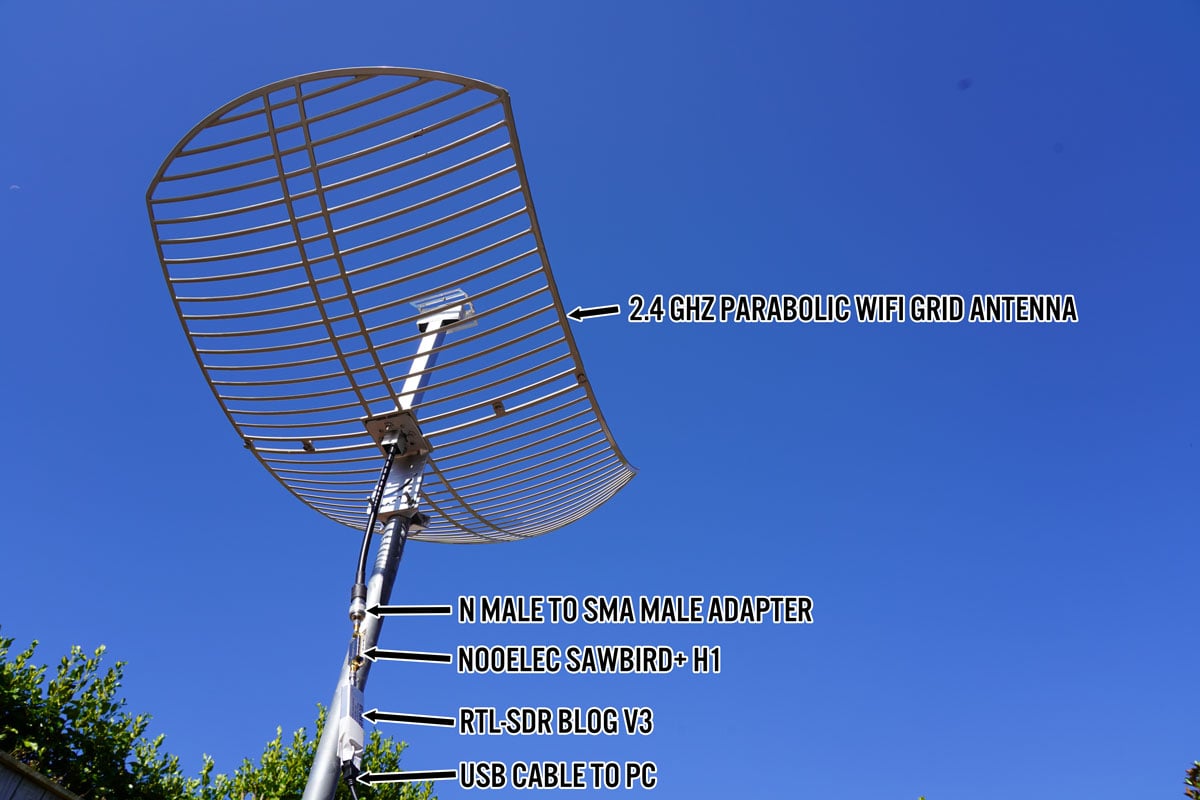
The recommended setup is simple. Antenna pointed straight up -> LNA -> RTL-SDR -> USB Cable -> PC.
Detailed instructions below:
- Construct the WiFi dish. This is just a matter of putting in a few screws to join the two panels and feed. Make sure the feed is mounted with the long axis matched with the grid direction. Also ensure the reflector is installed.
- Mount the dish outside pointing straight up into the sky. Once you are a little more advanced, you could try other elevations or even motorize it, but start with straight up for now. The rotation of the dish does not really matter as hydrogen line emissions are randomly polarized.
- Connect the RF side of the LNA to the antenna cable via the N-SMA adapter.
- Connect the RTL-SDR to the RF+DC side of the LNA.
- Connect a high quality USB cable from the RTL-SDR to your PC. We don't recommend using anything more than a few meters of coax between the LNA and RTL-SDR in order to optimize the signal levels.
- Do not use coax between the antenna and LNA. The LNA should be directly connected to the antenna output.
It may also be wise to waterproof your LNA and RTL-SDR if kept outdoors. This can be as simple as putting it in a plastic bag, or old coke bottle sealed with some putty.
Software Setup
In order to detect the hydrogen line we need to use software capable of integrating/averaging many FFT samples over time. Averaging the samples reduces the SDRs quantization noise, allowing the weak hydrogen line peak to be seen. Because the galaxy is moving fairly slowly in the sky, we can safely average for 5-10 minutes at a time.
For Linux, there are various programs that can be used. PICTOR, and rtl-obs are some good choices, but are a little more complicated to set up. But they have some good features like the ability to properly calibrate the results, and some interesting algorithms that could increase the SNR of the hydrogen line detection.
For this tutorial we will keep it as simple as possible, and we will use Windows, with SDR# and a SDR# plugin called "IF Average". We will also use a free astronomy program called Stellarium for tracking the Milky Way's galactic plane across the sky.
Stellarium Setup
- Download Stellarium from https://stellarium.org, and download the Windows version using the button up the top.
- If you opened Stellarium during the day you won't see any stars due to atmosphere simulation. Hit the 'a' key on the keyboard to disable atmosphere.
- Hit the F4 key to go into the options menu. Here we recommend increasing the brightness of the Milky Way to 6.0, to make it really obvious.
- We also suggest going to the markings tab, and turning ON the Azimuthal grid, which will provide a marker to Zenith (straight up in the sky).
- Check the location shown in the bottom left. If it's not right for you, press F6 to set the correct location.
- Use the mouse wheel or pinch controls to zoom out so that the entire sky is visible. Drag the mouse so that the camera is looking at Zenith (straight up into the sky).
- As Stellarium will have opened by default in full screen mode, press F11 to go to Windowed mode.
By clicking on an object within the Milky Way or behind it, you can find out the Galactic coordinates of where in the Galaxy you are pointing. This could be useful for comparing with already known results like those shown here. Right click to remove the info text about that object.
SDRSharp with IF Average Plugin Setup
Install SDRSharp, Blog V3/V4 drivers, and the IF Average Plugin
-
You can download the SDR# Program with IF Average plugin preinstalled at this Dropbox link. This is provided by Dr Daniel Kaminski, author of the IF Average plugin. If you download this zip, simply unzip it to a folder on your PC and open SDRsharp.exe. If you complete this step, you can skip directly to step 4. Alternatively, start from step 1 and download and install SDR# and the IF Average Plugin manually.
- Download the latest v1920 or newer version of SDR# from https://airspy.com/downloads/sdrsharp-x86.zip. Set up SDR# and the RTL-SDR as described in the Quickstart Guide at www.rtl-sdr.com/QSG.
- Download the IF average plugin. Daniel's GitHub contains the latest files.
To Download from GitHub, click the Green "Code" button, and the click "Download Zip"
- Open the Zip file and go into the SDR_AVE_new-master\Release folder. Then copy the following files into your SDR# plugins folder from Daniel's Releases GitHub folder:
- MonoGame.Framework.dll
- SDRSharp.Average.dll
- SharpDX.DXGI.dll
- SharpDX.Direct3D11.dll
- SharpDX.dll
- ft2.xnb
- Download the latest beta version of SDRSharp.Average.dll and copy it into the SDR# plugins folder. This new beta version allows the background correction to be saved as a file so you don't need to make a background correction everytime you start it up.
NOTE: If the above is not working, you should try installing the plugin on an older version of SDR#. Older versions of SDR# can be downloaded from https://www.iz3mez.it/software/SDRSharp. We tested the old plugin with SDRSharp v1727 and it worked well.
For older version of SDR# Daniel's website contains the older version here (called AVE for SDR#).
Alternatively, if there is some problem with the plugin website, the older version of his plugin is still available on his Dropbox. Go to Download->Direct Download to download it to your PC. We have also decided to mirror the plugin here on the blog server just in case the Dropbox file goes offline. You will need to use an older version of SDR# for these files.
Receiving and Averaging the Hydrogen Line FFT
- Open SDR#, select the RTL-SDR, press the start button.
- Adjust the RF Gain slider to the maximum, and check the "Bias Tee" checkbox. (If you are on an older version of SDR# select the "Offset Tuning" checkbox to enable the bias tee via the V3 driver hack)
- Tune to 1420 MHz and use the center tuning button to center the frequency (the button next to the frequency input in SDR#).
- Enable the IF Aver plugin by going to the Harmburger Menu (the three horizontal lines), and going to Plugins -> IF Average.
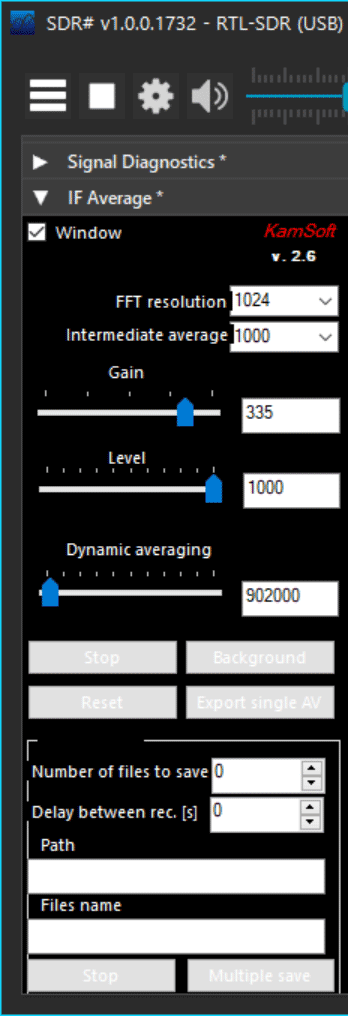
- Find the IF Average plugin on the right.
- We used the following settings which results in a 6-7 minute averaging time (but shorter averaging times would probably also work - try reducing the dynamic averaging a little):
- FFT resolution: 1024
- Intermediate Average: 1000
- Gain: ~335
- Level: 1000
- Dynamic Averaging: 902000
- Set up hardware for calibration:
- (Recommended) Point your dish to an empty spot in the sky (eg. far away from the Milky Way).
- (Alternative Method) Connect your LNA to the 50-ohm terminator for initial calibration. If you don't have a 50-ohm terminator, just leave the antenna disconnected.
- Check the "Window" checkbox, and immediately press the "Acq. Background" button to generate a reference background scan. This scan will be subtracted from subsequent scans thus removing the unwanted curved shape of the RTL-SDR and LNA filters. The first scan will take 6-7 minutes.
- Once the background scan is completed, you'll see the words "Corrected background!" in yellow in the top left of the FFT average window.
- You can now reconnect the antenna.
Tip: If the FFT Average Window keeps disappearing behind the main SDR# window, push the main SDR# window to the right and bring the IF Average Window to the left so that it does not sit on top of SDR#.
- You may need to adjust the Gain and Level sliders a little bit in order to get the FFT graph on the screen. Try to keep the Gain large, as this increases the FFT gain allowing you to see small peaks more clearly.
At this stage, you now need to wait for the Milky Way to enter your antennas beamwidth and watch for the H-line peak. The software will continually average the spectrum.
If you want to create a timelapse like the gif shown at the top of the post we can recommend a program called "Chronolapse", which takes a screenshot every X minutes. You can then convert those images into a movie or gif. The IF average plugin can also output data files which could be used for further analysis.
If you do not do the calibration at all, your spectrum will appear quite wavy. Be sure to not confuse those waves with the hydrogen line peak.
Example Results
Other Notes
- It is possible to get slightly higher SNR by covering the grid dish with foil, or a metal mesh. However, the improvement appears to be very small, almost negligible since the WiFi feed is only linearly polarized.
- Longer integration/average times will spread the peak out more. Smaller integration times may result in less SNR.
- You may wish to experiment with an elevation that maximizes the time spent pointing at the Milky Way for your location. Use Stellarium and the time shift feature (F5, or CTRL+ClickDrag) to find the optimal elevation. But lower elevations are more susceptible to man made interference.
- A motorized antenna mount would allow you to scan more of the Milky Way in one day. An example build from this previous post here.


