Browser Based Weather Station Graphs via RTL-SDR, rtl_433 and Dash.plotly
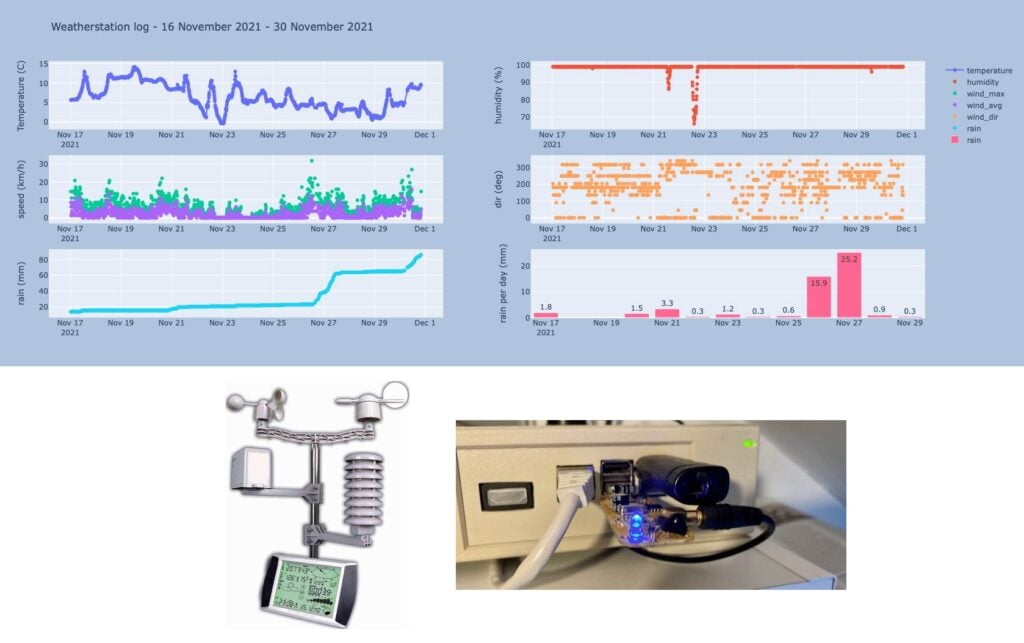
Thank you to Gerrit Polder who has submitted his project where he has used an RTL-SDR and the rtl_433 decoder running on a Raspberry Pi, along with some custom software to create a browser based dashboard for his wireless weather station.
Gerrit's weather station wirelessly displays data on a wirelessly connected LCD screen, but he notes how difficult it is to view historical data, or to graph trends. Having discovered that the rtl_433 RTL-SDR decoder supports his particular weather station (a Fine Offset Electronics WH1080/WH3080 compatible Weather Station (Alecto WS-4000)), Gerrit decided to write some code to log data to a SQL database, and display that data via a Python Dash.plotly web interface. The RTL-SDR, rtl_433 and custom software all run on a Raspberry Pi.
The interface allows Gerrit to view live and historical data all on neatly plotted graphs. HIs complete open source code can be found on Github.
