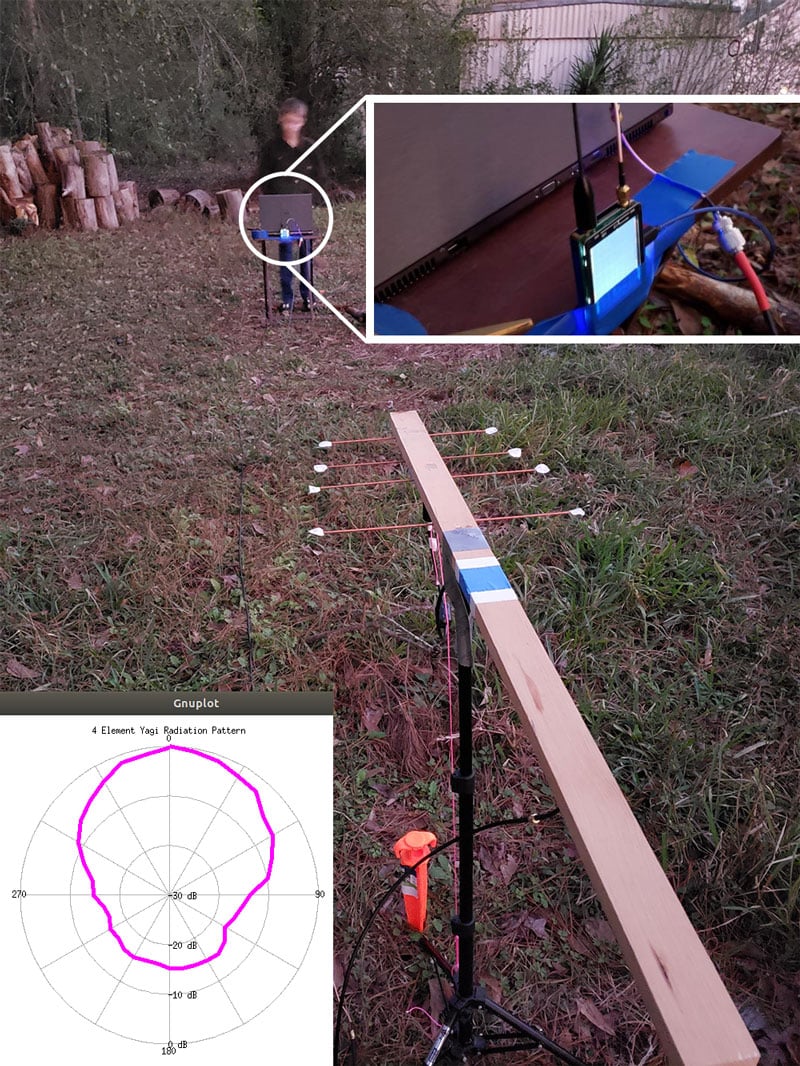
Measuring the Radiation Pattern of a Yagi Antenna with a NanoVNA
On Hackaday we've seen an interesting post about Jephthai who has used a NanoVNA to measure the radiation pattern of a home made Yagi antenna. He began by initially modelling the Yagi using the MMANA software package, then building the antenna and measuring the SWR.
However, SWR is only partial information and tells us nothing about the actual gain and directivity / radiation pattern of the antenna. The radiation pattern tells us in which direction the antenna receives and radiates power best from. For a Yagi, we would expect the best reception gain to come from the front, with much less gain on the sides and rear.
To set up the radiation pattern measurement, Jephthai connected the Yagi to the TX port of the NanoVNA via a long coax cable, and connected an omnidirectional whip antenna to the RX port of the NanoVNA. The NanoVNA and Yagi are separated by a reasonable distance of 18' to ensure that the far-field radiation pattern is measured instead of the near-field pattern. He then measures and collects the S21 reading over multiple rotations of the Yagi.
The data is then plotted revealing a two dimensional radiation pattern for the Yagi. As expected gain is highest in the front, and weaker on the sides and rear. Jephthai notes that the radiation pattern mostly matches what the MMANA antenna modelling software predicted too.


I would love to follow along .. but was ripped off by the Ebay seller of the RTLSDR Dongle whom cared not and lied about giving a refund. Still owed the money for a V3 that does not work at HF. (known issue as well !!)
Who was the seller, and is the dongle you received a V3 clone or original?
Using an external amp with the Nano-VNA
Measured Output power at the S11 port
10-100 MHz -13 dBm
100-300 MHz -9 dBm
300-900 MHz Some slope with frequency but -20 dBm is typical
So levels are around .0001 watts Not enough power to do any reasonable antenna testing.
So you are looking for an amp designed for 0 dBm input with 10-20 dB of gain.
Mini-Circuits has dozens of amps in this power range or you can build something up
with a single MMIC. Calibration is a challenge, you don’t want to connect the ports with
just the amp between them. Power levels are enough to damage the other port.
One way is to have a 20 dB gain amp followed by at 20 dB resistive pad. The other is
to just adjust your data 20 dB.
This technique can also be used to expand the dynamic range of the NANO VNA for measuring long runs of coax or filters with very deep skirts. But be careful! Kent
I agree, pretty pattern but the NANOVNA does not have enough dynamic range to have produced that plot.
I use a similar system on my antenna range, but with a R&S Spectrum analyzer doing the rec duties.
My rotator takes 58 seconds so I set the sweep time to 58 seconds and it produces a linear plot of the pattern.
The NANO VNA has no pre-selection, so it will pick up every AM, FM, TV, and WiFi signal in the area.
a passband filter for the frequency under test is highly suggested. Also a small amp on the output port of the NANOVNA will do wonders for the dynamic range of the readings. That setup has 40-45 dB of freespace pathloss which really eats up the NANOVNA’s dynamic range. There is where a small amp really helps.
Please recommend an example amp, which specs matter, source.
Thanks
Here is an interesting side note of the same type of measurement using the nanoVNA:
https://owenduffy.net/blog/?p=16468
The receiving antenna is verticaly polarized and transmitting antenna is horizontaly polarized.
So, radiation pattern is very doubtfull.
Hi jephtami’s. That sounds like a good idea. I shall have a go at that in the summer. Try some antennas I have made.