Radio Astronomy Tool rtl_power_fftw Updated
The rtl_power program allows you to use the RTL-SDR to perform a power scan over an arbitrarily large portion of the frequency spectrum (within the RTL-SDR’s supported frequency range) by hopping over ~2 MHz swaths of bandwidth. The updated rtl_power_fftw software was originally written by Klemen Blokar and Andrej Lajovic and is an update over the regular rtl_power program. It uses a faster FFT processing algorithm and has several other enhancements that make it more useful for radio astronomy purposes.
Recently Mario Cannistrà has released a new version of rtl_power_fftw which has several additional improvements applied. He intends to use it in his RTL-SDR based radio astronomy IoT project which is presented on his Hackster.io blog. He writes:
I added the following command line parameters:
- -e param for session duration
this allows to specify the recording duration in sec, mins… etc just like it was possible with rtl-power- -q flag to limit verbosity
this will allow the various printouts to happen only the first time and not on every scan- -m param to produce binary matrix output and separate metadata file
this will get a file name (no extension) and use it to store the power values in binary format within a .bin file + a metadata text file with .met extensionSummary of my requirements:
- I wanted to leverage the ability of rtl-power-fftw to specify N average values to integrate for less than 1 second when needed. Plus running multi-MHz scans and storing for several minutes.
- I wanted to use a binary format instead of the .csv one in order to obtain the smallest possible size since I’m logging all the night long (CSV’s blank delimiters and decimal dots were wasting my precious microSD space)
- keep high the precision on decimal digits saving float values (could be important for other usages)
- obtain a complete stream of binary values representing all the bins for each scan, one scan after the other, in a matrix like organization
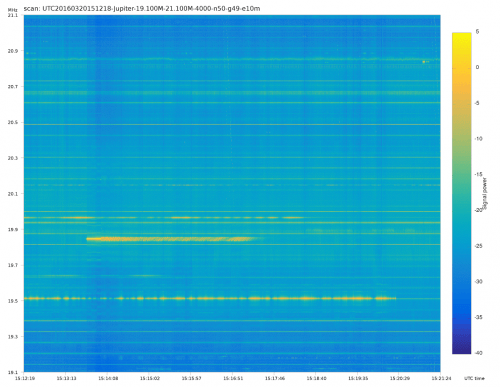
- …that would allow me to plot the waterfall extremely fast with gnuplot
- …and then add specific annotations and file properties/metadata in a more convenient way using python

