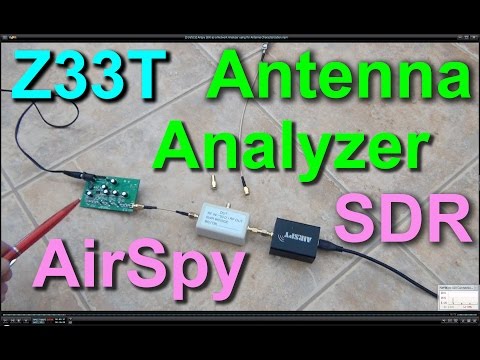
Using the Airspy as a Network Analyzer for Characterizing Antennas
Over on YouTube user Mile Kokotov has uploaded a very nice tutorial video that shows how the Airspy can be used as a low cost scalar network analzyer from between 0.1 – 1800 MHz. A network analyser allows you to characterize the performance of antennas, by determining the antenna SWR curve. A low point on an SWR graph indicates the frequency at which an antenna is resonant/tuned, so a network analyzer is very useful for tuning homemade or adjustable antennas.
Dedicated scalar network analyzers can costs thousands of dollars. Together with a cheap noise source and cheap directional coupler, the Airspy can be used as a very low cost scalar network analyzer for analyzing antennas. If you are interested in this we also have a similar tutorial on our blog that shows how to do this with an RTL-SDR. However, the Airspy R2 or Mini is of course a better tool for this job as it can scan the spectrum much faster than the RTL-SDR with its Spectrum Spy software. Mile writes:
In this video I am showing how Airspy SDR can be used for measuring Return Loss, Antenna SWR and Antenna Bandwidth of several commercial and homemade antennas.
The impedance of the Radio Station (transmitter or receiver) must be well matched to the antenna’s impedance if we want maximum available power to be delivered to antenna.
The return loss and SWR measurements show us the match of the system.
A poorly matched antenna will reflect costly RF energy which will not be available for transmission and will instead end up in the transmitter. This extra energy returned to the transmitter will not only distort the signal but it will also affect the efficiency of the transmitted power and the corresponding coverage area.
Return Loss and SWR both display the match of the system, but they show it in different ways. The return loss displays the ratio of reflected power to reference power in dB.
The return loss view is usually preferred over the SWR linear scale, because is easier to compare a small and large number on a logarithmic scale.
More than 20 dB system return loss is considered very efficient as only less than 1% of the power is returned and more than 99% of the power is transmitted. In that case the SWR is around 1.2
For radio amateur usage, Return loss more than 14 dB is acceptable. This is adequate to SWR of 1.5 which means that 4% of the power is returned and 96% of the power is transmitted.
0 dB Return loss represent an open or a short antenna terminal, while 45 or more dB Return loss would be close to a perfect match.
Many different methods can be used to measure standing wave ratio. Professionals usually use a vector network analyzer or frequency analyzer with sweep signal generator and directional coupler.
In this video I will show you very cheap and very good method for antenna characterizing which means measuring the Return loss versus frequency and usable antenna bandwidth like measuring with much, much more expensive, state of the art Network Analyzers and similar measuring equipment.
EDIT: It has been pointed out that we incorrectly used the term vector network analyzer in the previous title, when we should have instead used scalar network analyzer. A scalar network analyzer can measure amplitude, but a vector network analyzer can measure amplitude and phase and is a more complex device. Apologies for any confusion.


One clarification on the information presented above and in the video. Reflected power does not “go back into the transmitter” – it is added to the forward power during the next cycle. So if 10 watts out and 1 watt is reflected, the next cycle will have 11 watts out and one reflected, for a sum of 10 total watts.
When a problem exists in a mismatch it is when there is a problem in the feedline (or antenna) which causes the transmitted power to be dissipated as heat.
If a signal is distorted it is not because reflected power is getting back into the transmitter, but rather because of poor shielding such that RF from the antenna is getting into the unit – this would happen to a poorly shielded transmitter regardless of the quality of the signal output.
Great posting, as always!
Thanks! BTW, the network analyzer as shown in the video will have a frequency range of between 24 MHz – 1800 MHz since only the Airspy is used. You could use the SpyVerter which will upconvert from 0 – 60 MHz to the 120 MHz – 180 MHz band, but then you lose visibility of that band. Can SpyVerter be put into bypass mode (no upconversion) or do you physically have to remove it? Not a big deal really, two separate scans can be taken. Besides, the antenna one uses for HF frequencies is almost certainly not going to be the same as one used for 2 meters.
The other option is to use an SDR that covers 0.01 – 2 GHz continuous …
Yes you’ll need to use the Spyverter to get the lower frequencies, and it needs to be switched out manually. The RSP could also be used as a network analyzer, but at the moment I believe they don’t have any compatible scanning software like Spectrum Spy or rtl_power, and the scanning speed of the RSP is as of yet unknown. Hopefully they will release something similar to Spectrum Spy in the near future.
Thanks for the clarification on the capabilities of the Airspy and the software support for RSP. Might be a pretty good project to roll my own scanning spectrum analyzer with the RSP just for fun …
AIRSPY is the best, fuck the rest!