Tagged: SWR

Video Introduction to Scattering Parameters with Animated Examples

Thank you to Apostolos for sharing with us his educational video that introduces "scattering parameters" (aka S-Parameters), and how these parameters relate to antennas and RF networks. S-Parameters are a matrix of values that can be used to describe an electrical network. Apostolos' video explains these parameters in detail, giving good visual examples. Apostolos writes:

Here are the topics I cover:

  • What is a 'Network'?
  • Power Waves
  • Complex Impedance & Phase Angle
  • S-Matrix & S-Parameters
  • Reflection & Transmission Coefficients
  • Standing Waves
  • Example Networks
  • Designating S-Parameters
  • Reciprocity & Losslessness
  • Reflection Coefficient and VSWR
A Visual Introduction to Scattering Parameters

Measuring the SWR of FPV Antennas with an RTL-SDR

FPV stands for 'First Person View', and is a term used to describe the hobby of flying remote controlled aircraft entirely via the view from a wireless camera that transmits live video to the pilots screen or video goggles.

Part of the FPV hobby is to not only enjoy flying, but also to tweak the wireless video equipment for maximum range and reliability. This involves measuring the SWR characteristics of FPV antennas. SWR is a metric that describes how well the impedance of an antenna is matched with the receiver at a certain frequency. Poor SWR results in additional signal loss on top of cable and connector loss. We note that SWR is only one antenna metric, and doesn't take into account radiation pattern and antenna gain which is often more important, but it is the easiest metric to measure and control, and should give you some idea as to if an antenna was designed and tuned properly.

As FPV hobbyists are often not hams or radio professionals, most don't have access to the equipment required to measure SWR. So over on his YouTube channel bonafidepirate shows how he's been using a cheap RTL-SDR, noise source and RF Bridge to measure the SWR of his FPV antennas. The process is similar to the one shown in our tutorial, but he uses the Spektrum software which allows you to measure SWR entirely within the software itself.

In the video bonafidepirate goes over the required hardware, software and the setup, and then demonstrates several SWR scans of different FPV antennas.

DIY VSWR Meter for FPV, Lets test some antennas!

Tuning an HF Antenna with an Airspy, SWR-Bridge and Noise Source

Over on his blog Anders J. Ørts has created a good writeup showing how he used the combination of an Airspy SDR with SpyVerter upconverter, SWR-Bridge and a noise source to tune his HF dipole for the 40 meter and 20 meter bands. If you’re interested we also have a writeup on doing something similar with the RTL-SDR here.

By connecting the output of the noise source to the SWR-bridge input, and the antenna to the DUT port the return loss or SWR of the antenna can be measured with the Airspy. To get a wider than 10 MHz view of the spectrum Anders uses the SpectrumSpy software for the Airspy which is a spectrum analyzer application that allows you to view any bandwidth that you like. With the Airspy, noise source and antenna all connected correct to the SWR-Bridge significantly notches in the spectrum show up in SpectrumSpy. These notches are the resonant points of the antenna. Visually seeing these notches allows you to fine tune the length of the antenna elements for best SWR.

How to connect it all up
SpectrumSpy showing the resonant notches at 40m and 20m.

Using a TV Antenna Tap as a Directional Coupler for Antenna Measurements with an RTL-SDR

Over on his blog Tomi Engdahl has been exploring his options for measuring the VSWR of antennas with an RTL-SDR. As discussed in one of our previous tutorials, by using an RTL-SDR, noise source and directional coupler it is possible to roughly estimate the resonant frequency of an antenna.

However, being without a directional coupler Tomi looked for other options and realized that cheap TV antenna network taps are also directional couplers. Taps are commonly used with Cable and Satellite TV installations to split a signal from an antenna over multiple TVs. They are designed as directional couplers to ensure that unwanted signals do not feed back into the antenna system and so that there is a pass through port to continue the strong signal down a long cable. 

Note that there is a difference between a tap and a splitter. Taps are used when multiple devices need a signal over a long run of cabling. A splitter divides the signal strength by the number of out ports and can feedback unwanted signals into the system.

Taps vs. Splitter Example (Source: http://forums.solidsignal.com/showthread.php/5843-Solid-Signal-s-WHITE-PAPER-The-NEW-DIRECTV-Residential-Experience)

In his tests Tomi found that TV taps worked acceptably well to determine the resonance frequency of an antenna that he was testing. Taps can be found for as cheap as $2 on sites like eBay, although for some listings it is unclear over what frequency range they work well at as sellers assume that they will be used for TV frequencies.

Tomi also tested to see if he could use a signal splitter instead of a directional coupler tap. His results showed that the splitter still worked, and he was able to see the resonant points, but the results where not as good as with the directional coupler.

Measuring the resonant point of a antenna with a noise source, tap, and RTL-SDR.

Using the Airspy as a Network Analyzer for Characterizing Antennas

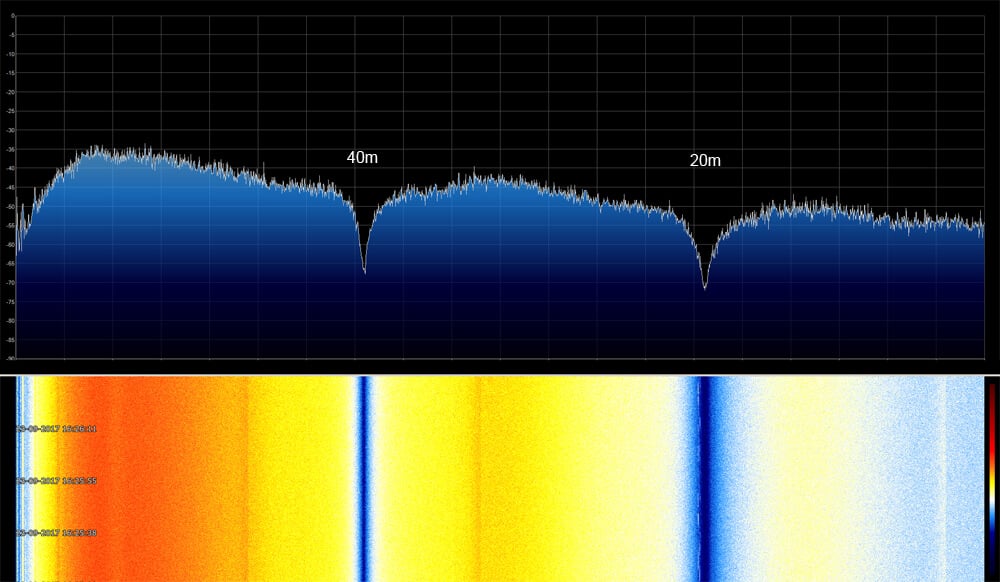
Over on YouTube user Mile Kokotov has uploaded a very nice tutorial video that shows how the Airspy can be used as a low cost scalar network analzyer from between 0.1 – 1800 MHz. A network analyser allows you to characterize the performance of antennas, by determining the antenna SWR curve. A low point on an SWR graph indicates the frequency at which an antenna is resonant/tuned, so a network analyzer is very useful for tuning homemade or adjustable antennas.

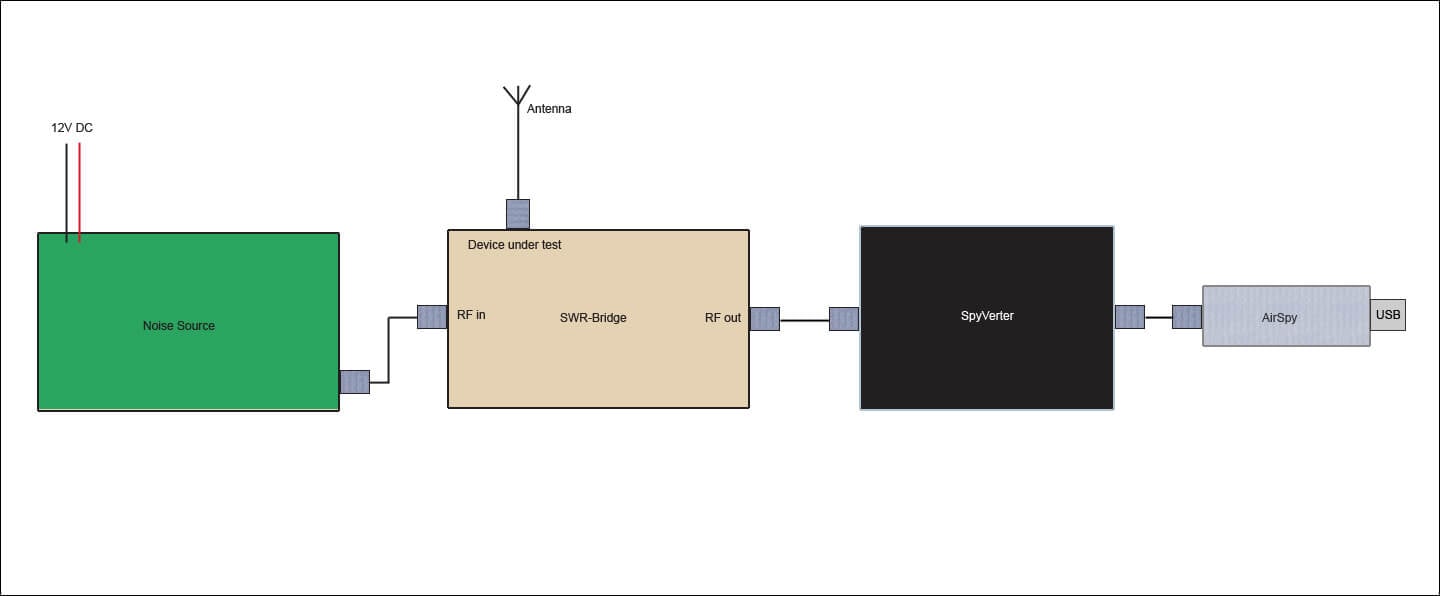
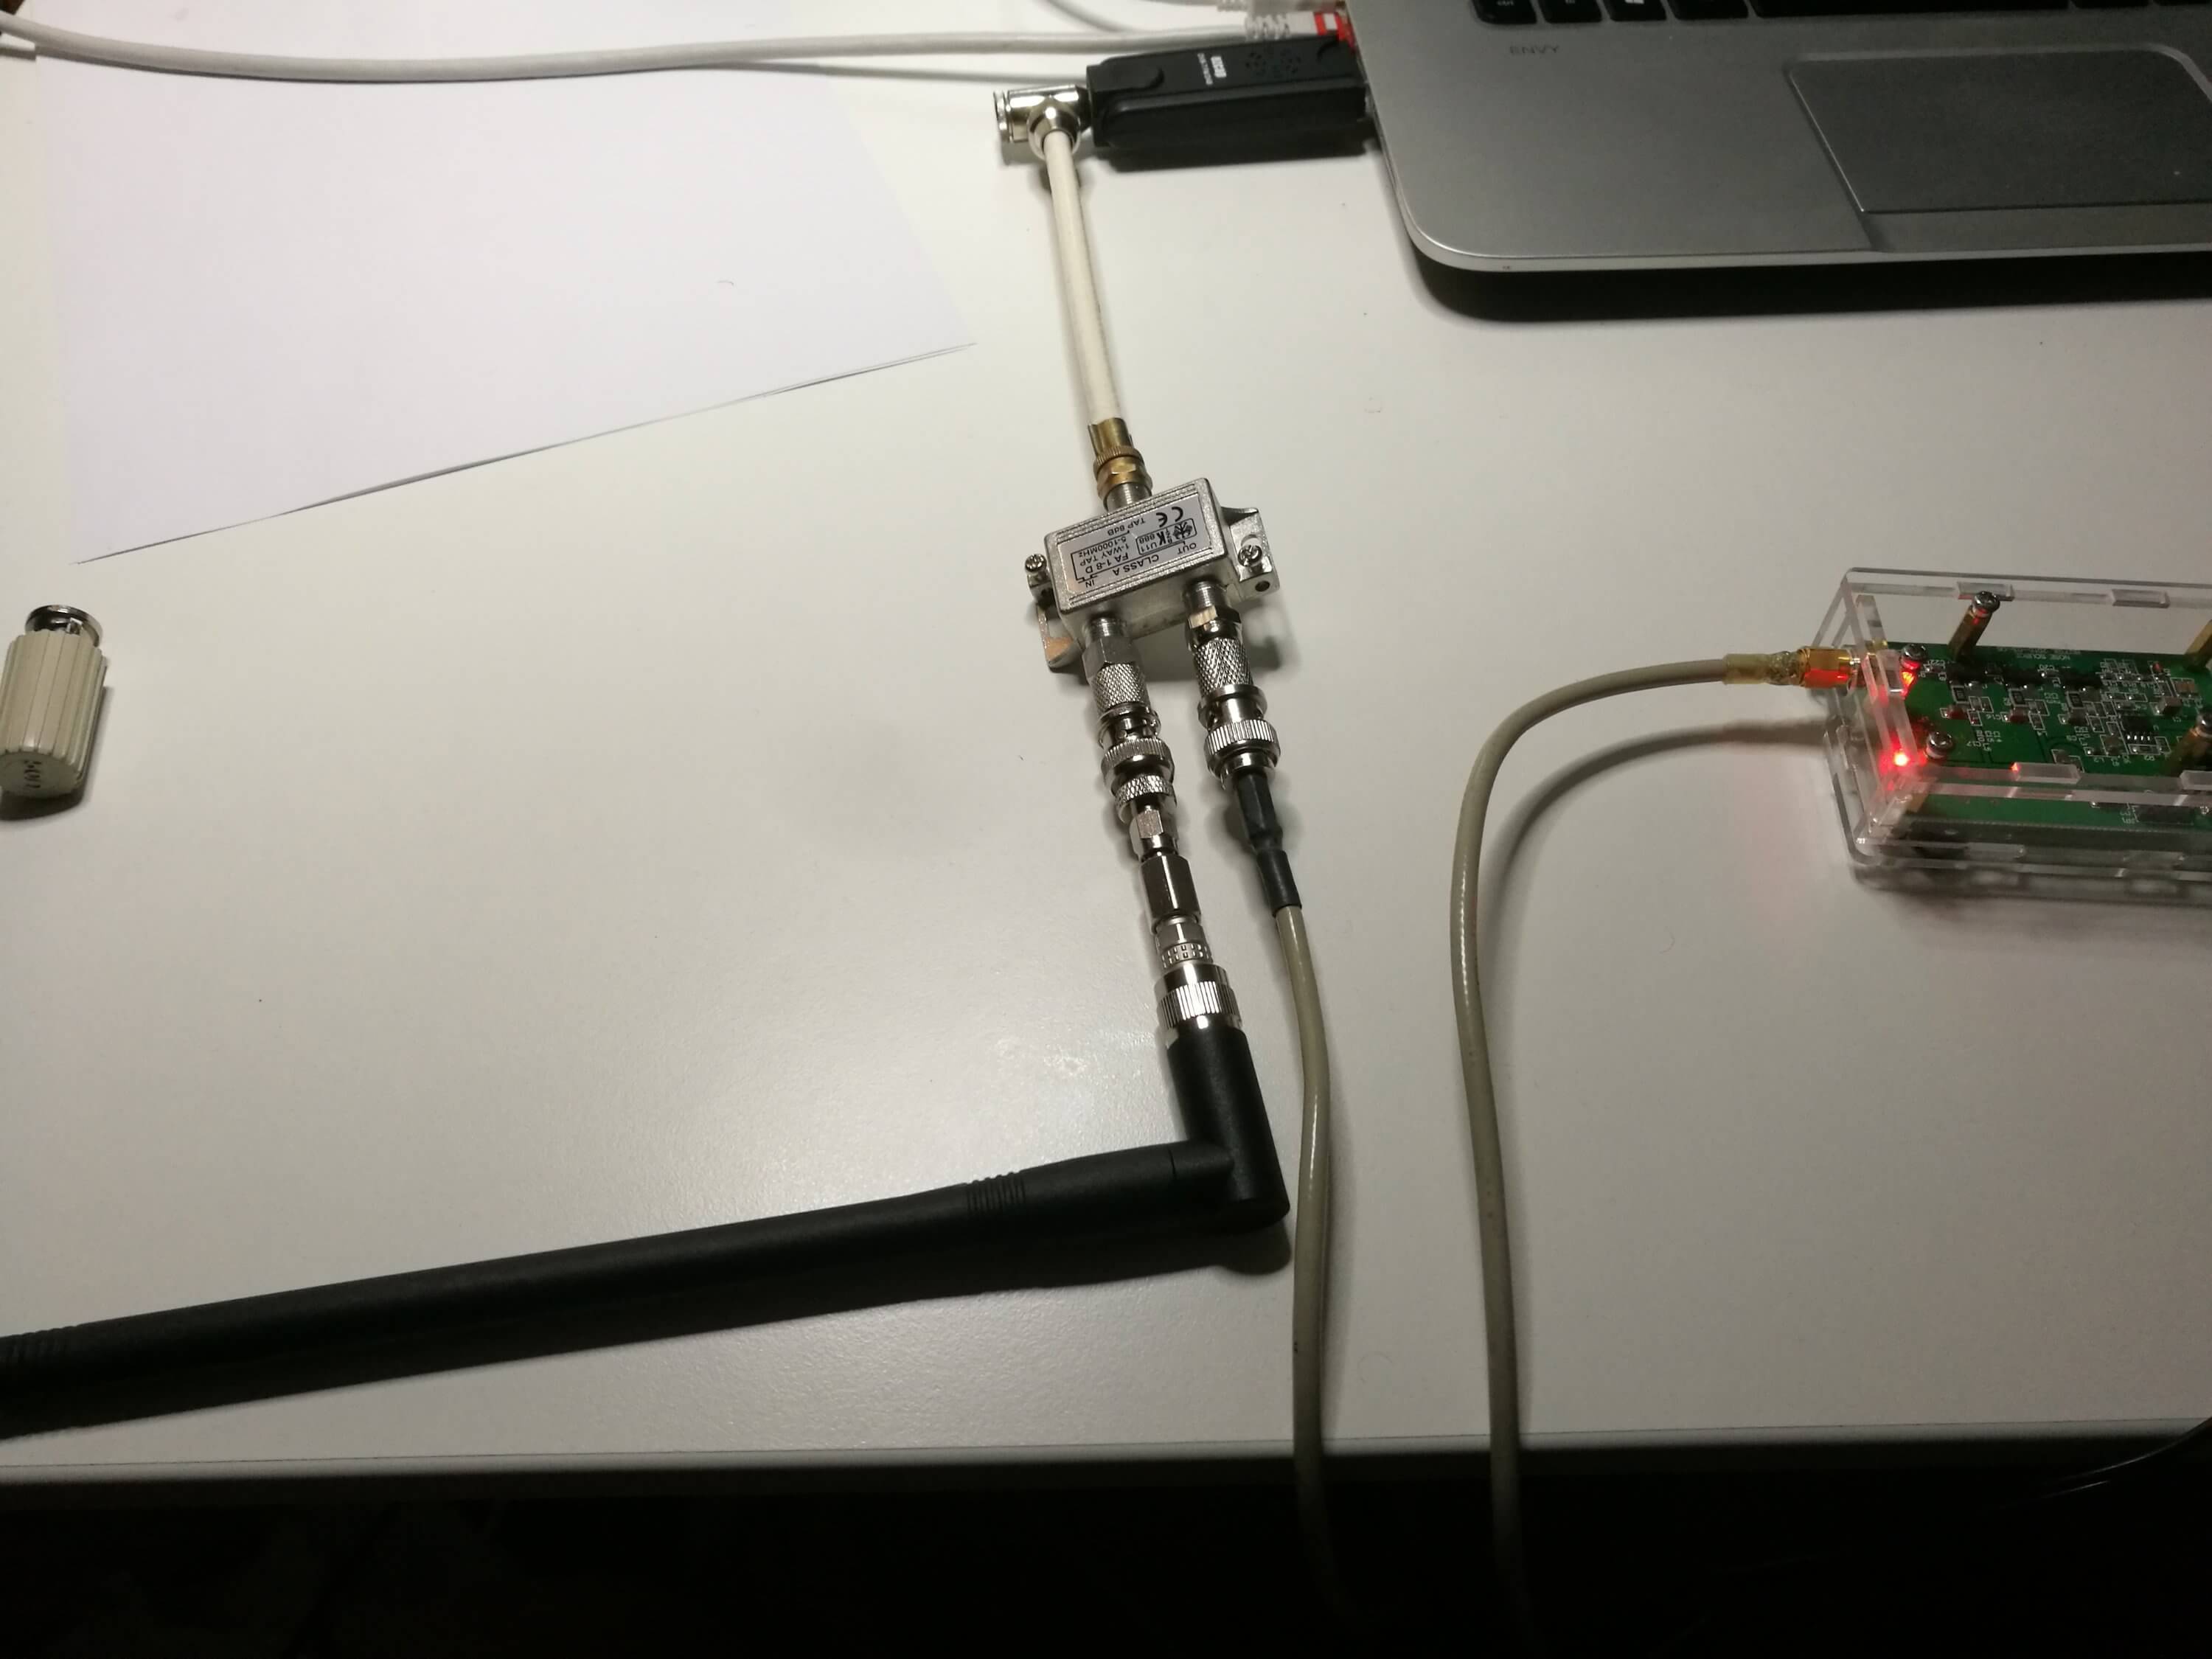
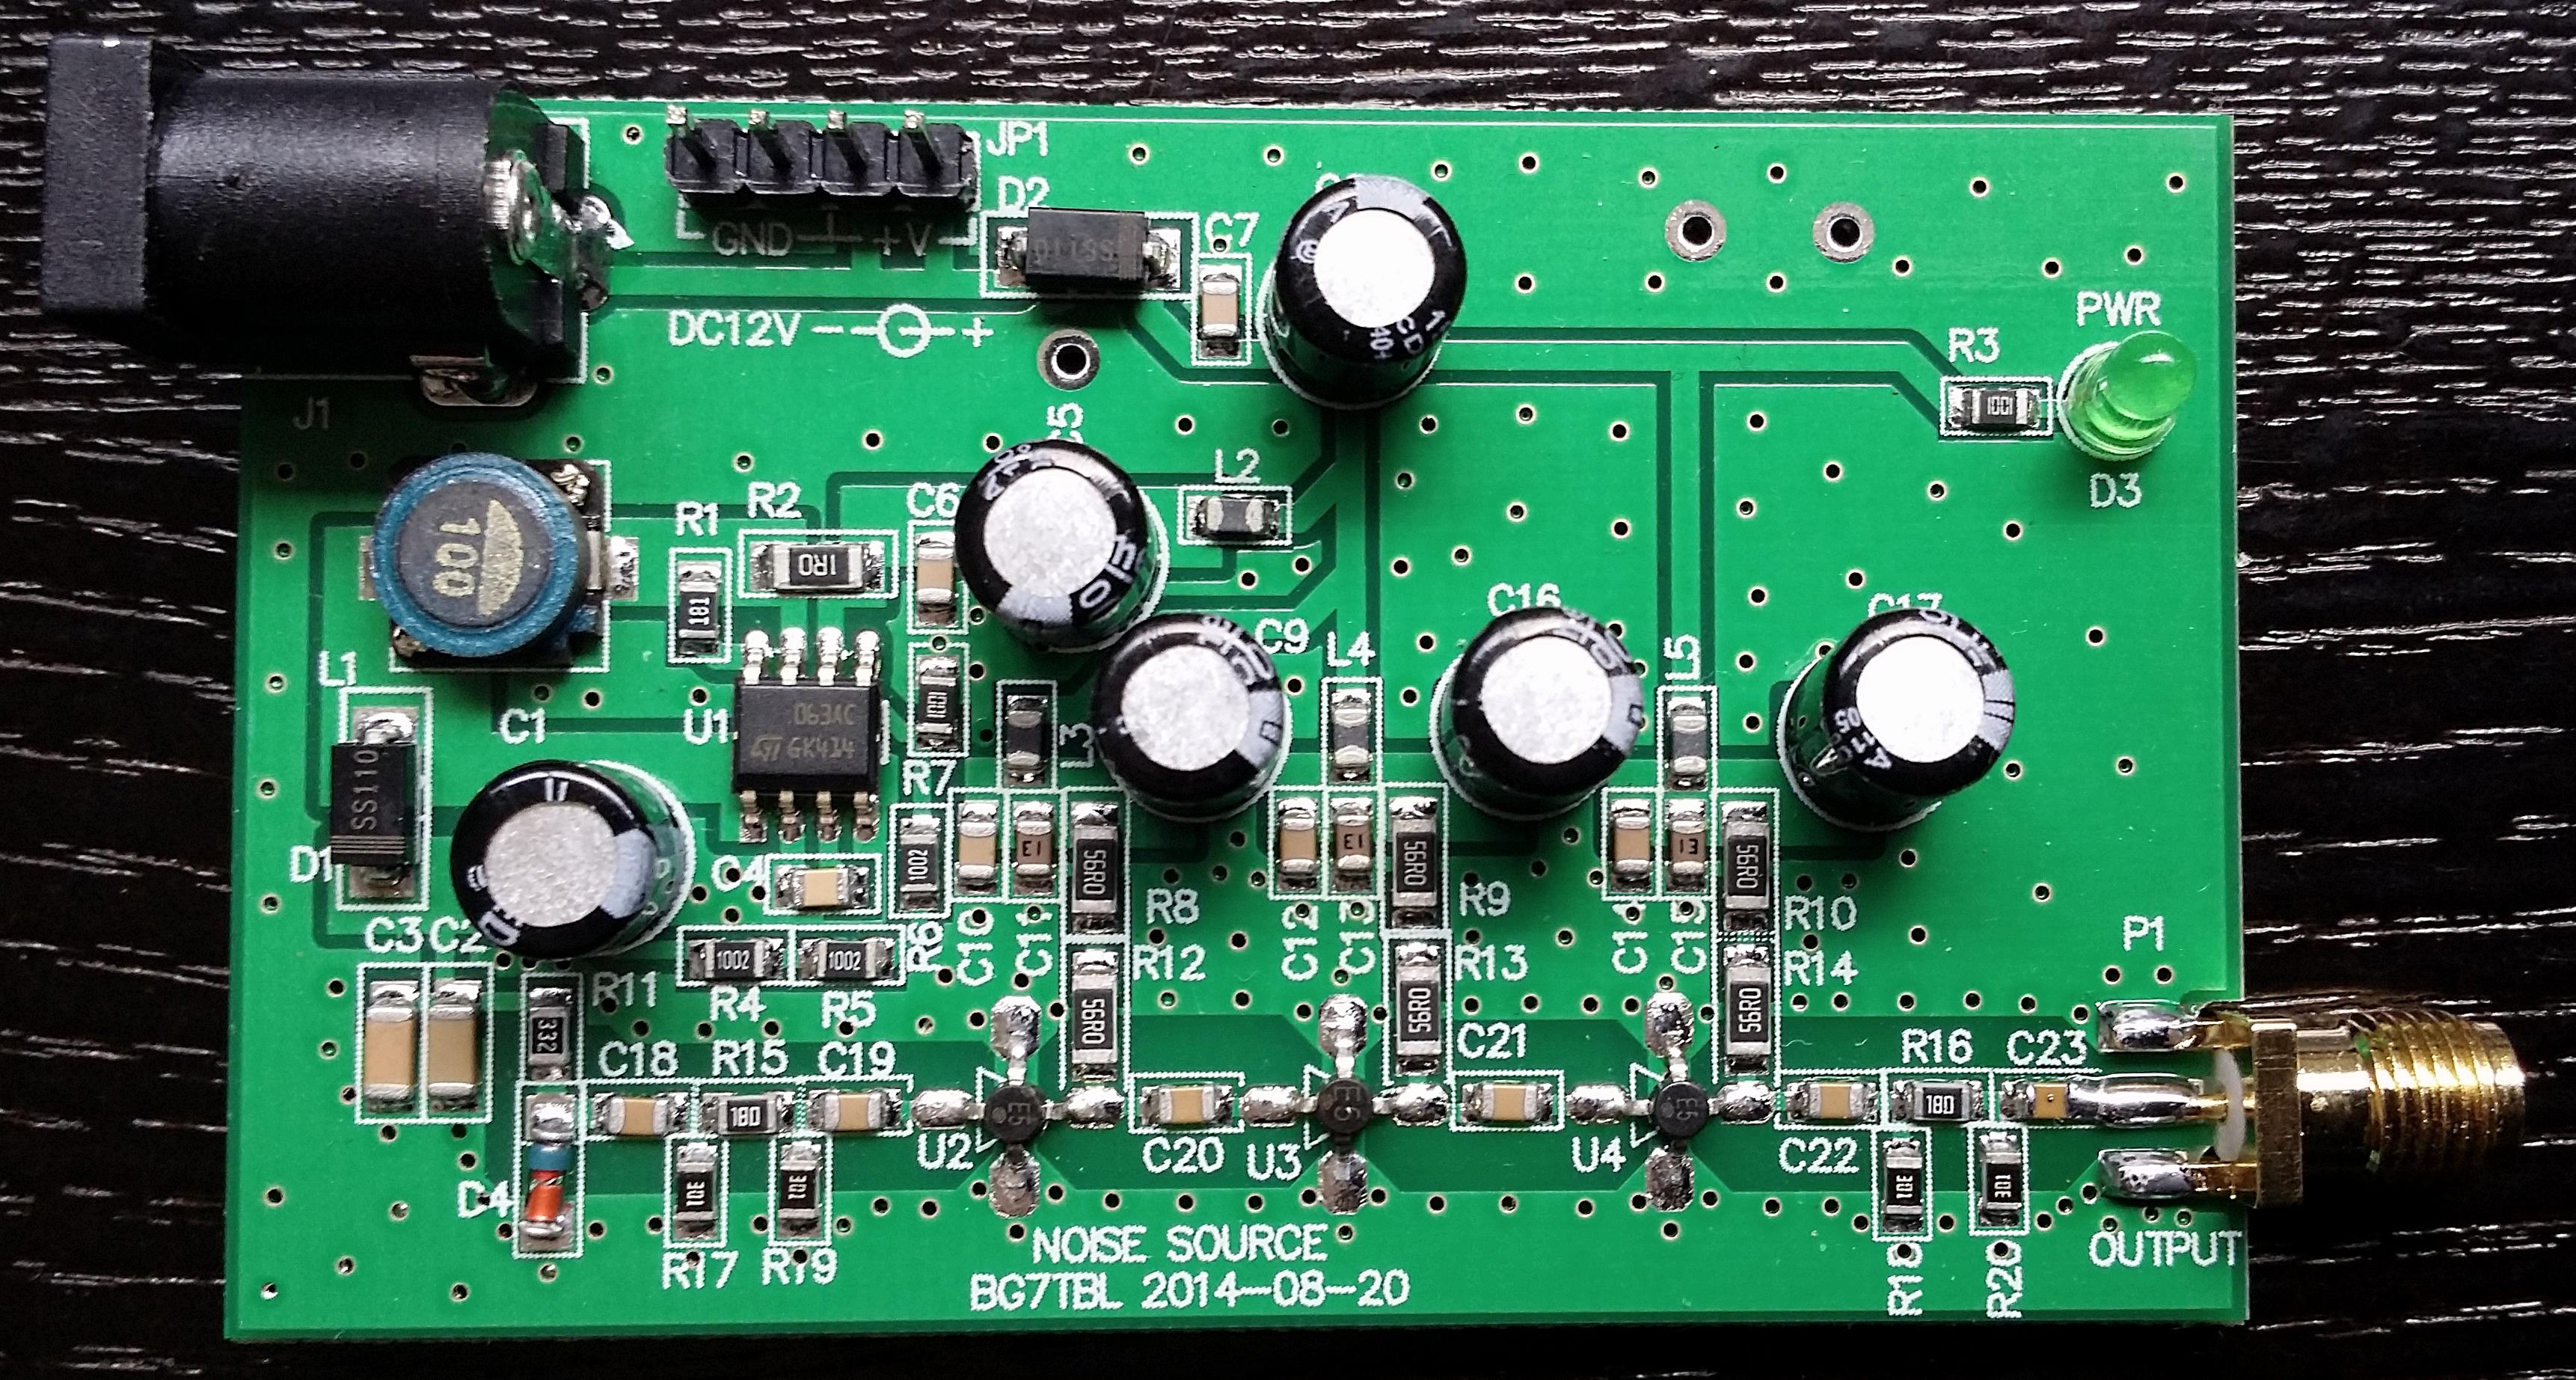
Dedicated scalar network analyzers can costs thousands of dollars. Together with a cheap noise source and cheap directional coupler, the Airspy can be used as a very low cost scalar network analyzer for analyzing antennas. If you are interested in this we also have a similar tutorial on our blog that shows how to do this with an RTL-SDR. However, the Airspy R2 or Mini is of course a better tool for this job as it can scan the spectrum much faster than the RTL-SDR with its Spectrum Spy software. Mile writes:

In this video I am showing how Airspy SDR can be used for measuring Return Loss, Antenna SWR and Antenna Bandwidth of several commercial and homemade antennas.

The impedance of the Radio Station (transmitter or receiver) must be well matched to the antenna’s impedance if we want maximum available power to be delivered to antenna.

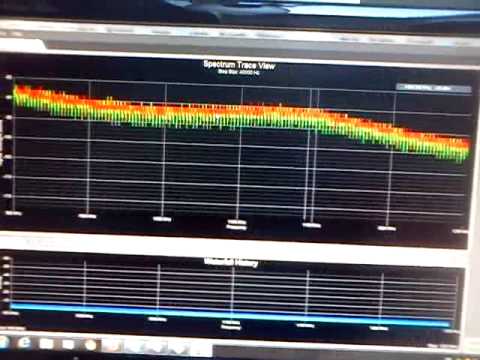
The return loss and SWR measurements show us the match of the system.

A poorly matched antenna will reflect costly RF energy which will not be available for transmission and will instead end up in the transmitter. This extra energy returned to the transmitter will not only distort the signal but it will also affect the efficiency of the transmitted power and the corresponding coverage area.

Return Loss and SWR both display the match of the system, but they show it in different ways. The return loss displays the ratio of reflected power to reference power in dB.

The return loss view is usually preferred over the SWR linear scale, because is easier to compare a small and large number on a logarithmic scale.

More than 20 dB system return loss is considered very efficient as only less than 1% of the power is returned and more than 99% of the power is transmitted. In that case the SWR is around 1.2

For radio amateur usage, Return loss more than 14 dB is acceptable. This is adequate to SWR of 1.5 which means that 4% of the power is returned and 96% of the power is transmitted.

0 dB Return loss represent an open or a short antenna terminal, while 45 or more dB Return loss would be close to a perfect match.

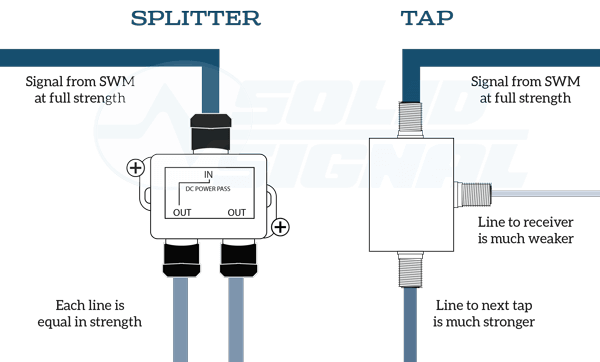
Many different methods can be used to measure standing wave ratio. Professionals usually use a vector network analyzer or frequency analyzer with sweep signal generator and directional coupler.

In this video I will show you very cheap and very good method for antenna characterizing which means measuring the Return loss versus frequency and usable antenna bandwidth like measuring with much, much more expensive, state of the art Network Analyzers and similar measuring equipment.

Airspy SDR as a Network Analyzer using for Antenna Characterization

EDIT: It has been pointed out that we incorrectly used the term vector network analyzer in the previous title, when we should have instead used scalar network analyzer. A scalar network analyzer can measure amplitude, but a vector network analyzer can measure amplitude and phase and is a more complex device. Apologies for any confusion.

RTL-SDR Tutorial: Measuring filter characteristics and antenna VSWR with an RTL-SDR and noise source

By using an RTL-SDR dongle together with a low cost noise source it is possible to measure the response of an RF filter. Also, with an additional piece of hardware called a directional coupler the standing wave ratio (SWR) of antennas can also be measured. Measuring the response of a filter can be very useful for those designing their own, or for those who just want to check the performance and characteristics of a filter they have purchased. The SWR of an antenna determines where the antenna is resonant and is important for tuning it for the frequency you are interested in listening to.

These tutorials are based heavily on information learned from Adam Alicajic's (9A4QV), videos which can be found at [1], [2], [3], [4]. Adam is the creator of the LNA4ALL and several other RTL-SDR compatible products. Recently Tim Havens also posted some experiments with characterizing home made filters on his blog.

Characterizing Filters

Using just a noise source and RTL-SDR dongle it is possible to determine the properties of an RF filter. In our experiments we used the following equipment:

Equipment

The BG7TBL noise source is a wideband noise source that can provide strong noise over the entire frequency range of the RTL-SDR. It requires power from a 12V source which can be obtained from a common plug in power supply. It also uses an SMA female connector, so you may need some adapters to connect it to your filter under test (adapters can be found cheaply on Ebay). Finally a quick warning: be careful when handling the circuit board after it has been powered for some time as some of the components can get very hot. Note that if the Ebay store runs out of these there is also a seller on Aliexpress with some available, just type "noise source" in the search bar.

The BG7TBL Noise Source

If you have a ham-it-up upconverter and are good at soldering small surface mount components you might instead consider purchasing the noise source kit add on. Here is a video showing how to build and test the ham-it-up noise source. Continue reading

Characterizing the SWR of an Antenna with a Noise Source and an RTL-SDR

In our last post Adam Alicajic showed us on YouTube how to determine the frequency response of an RF filter using just a wideband noise source an LNA and an RTL-SDR dongle.

In his latest video Adam shows how the SWR of an antenna can be measured using almost the same low cost equipment. One additional piece of hardware required to measure the SWR is a directional coupler which can be bought on Ebay for about $10 USD.

SWR stands for “standing wave ratio” and is a measure that can be used to tune an antenna for a particular frequency. The closer the SWR is to 1:1 at the designed antenna frequency, the better the antenna will receive (and transmit).

In his video Adam shows how he measures the SWR of an ADS-B antenna which he has built and is selling. His results show that the antenna has an SWR of 1:1.02 at 1090 MHz which is quite good.

DIY Characterize the antenna Retrurn Loss / SWR with the DVB-T SDR