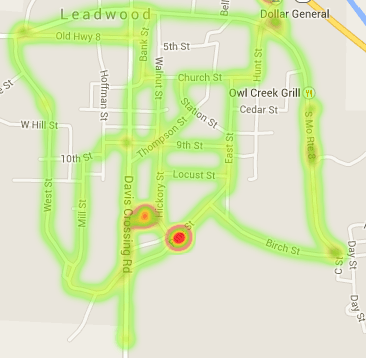
A few days ago we posted about Tim Havens “driveby” project, which is a RTL-SDR based system he developed to help create heatmaps of power line noise in his neighborhood. Upon doing further research, Tim discovered that the main source of power line interference was appearing at a frequency of 44.252 MHz. Then by using his driveby system to create a heatmap of his area at this frequency and also by using a hand held radio he was able to pinpoint a massive source of power line noise.
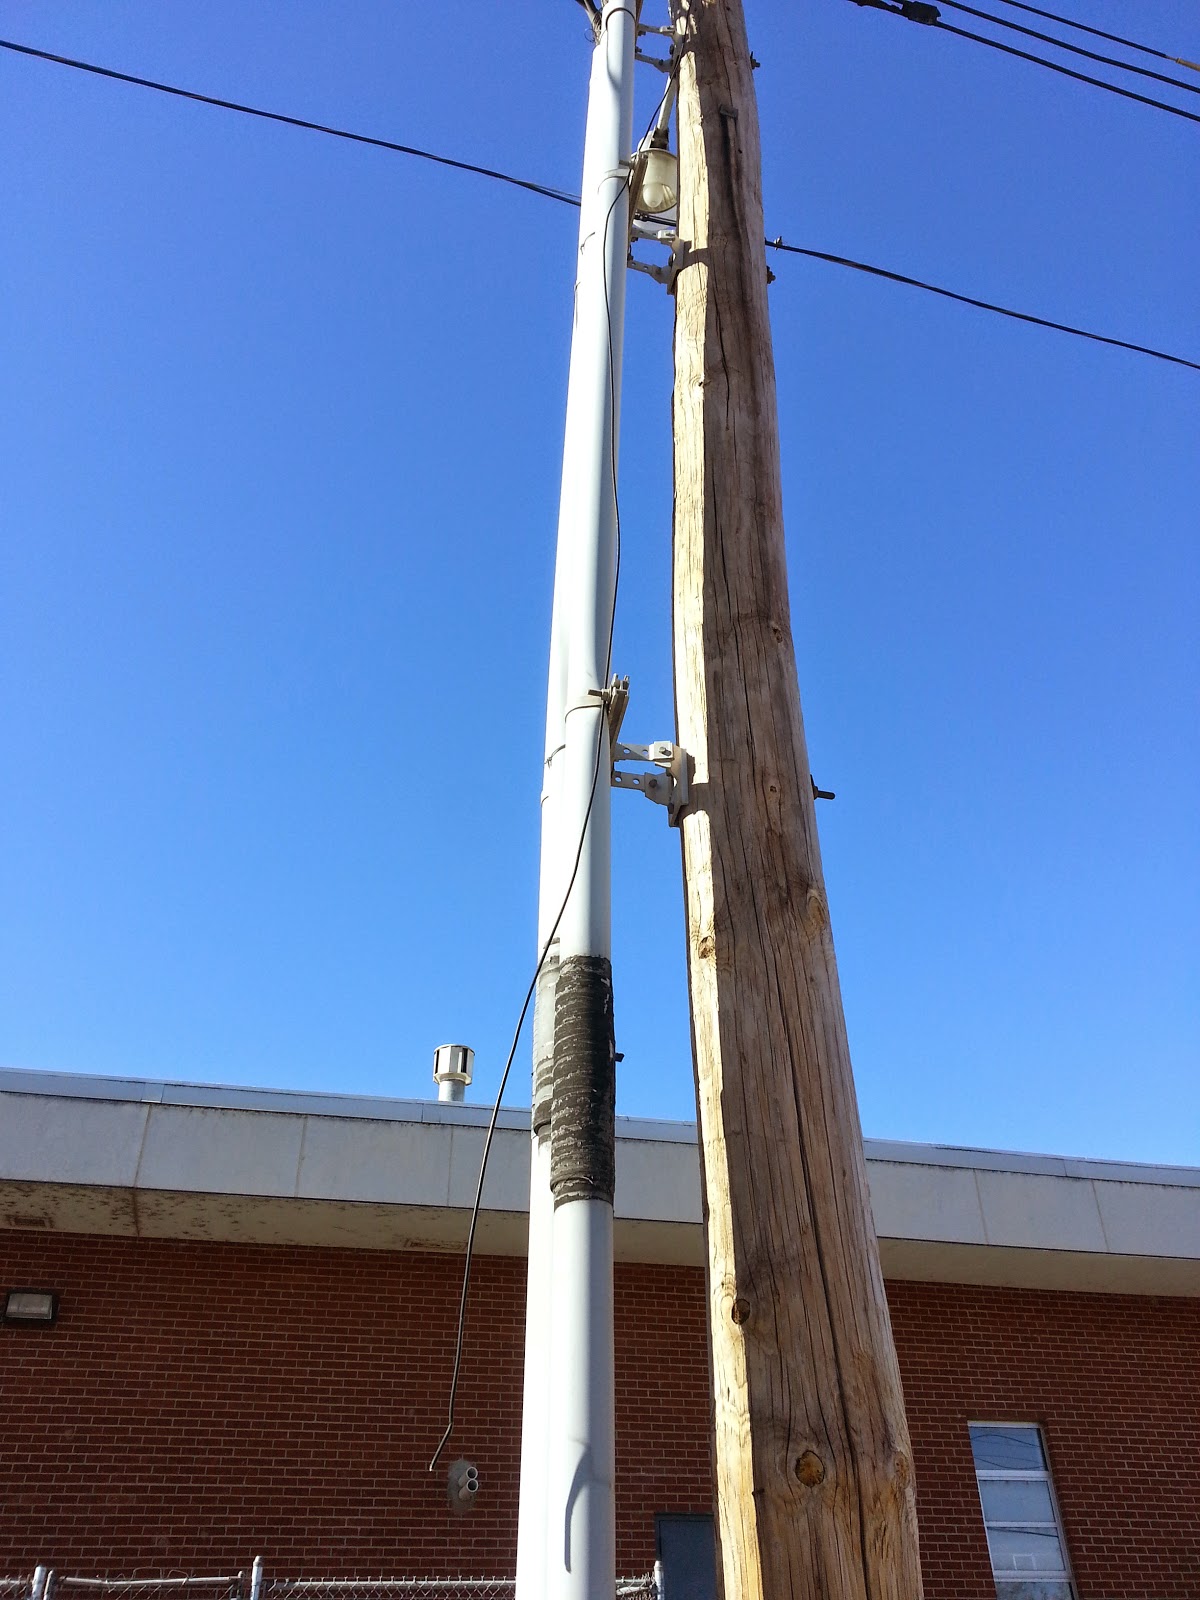
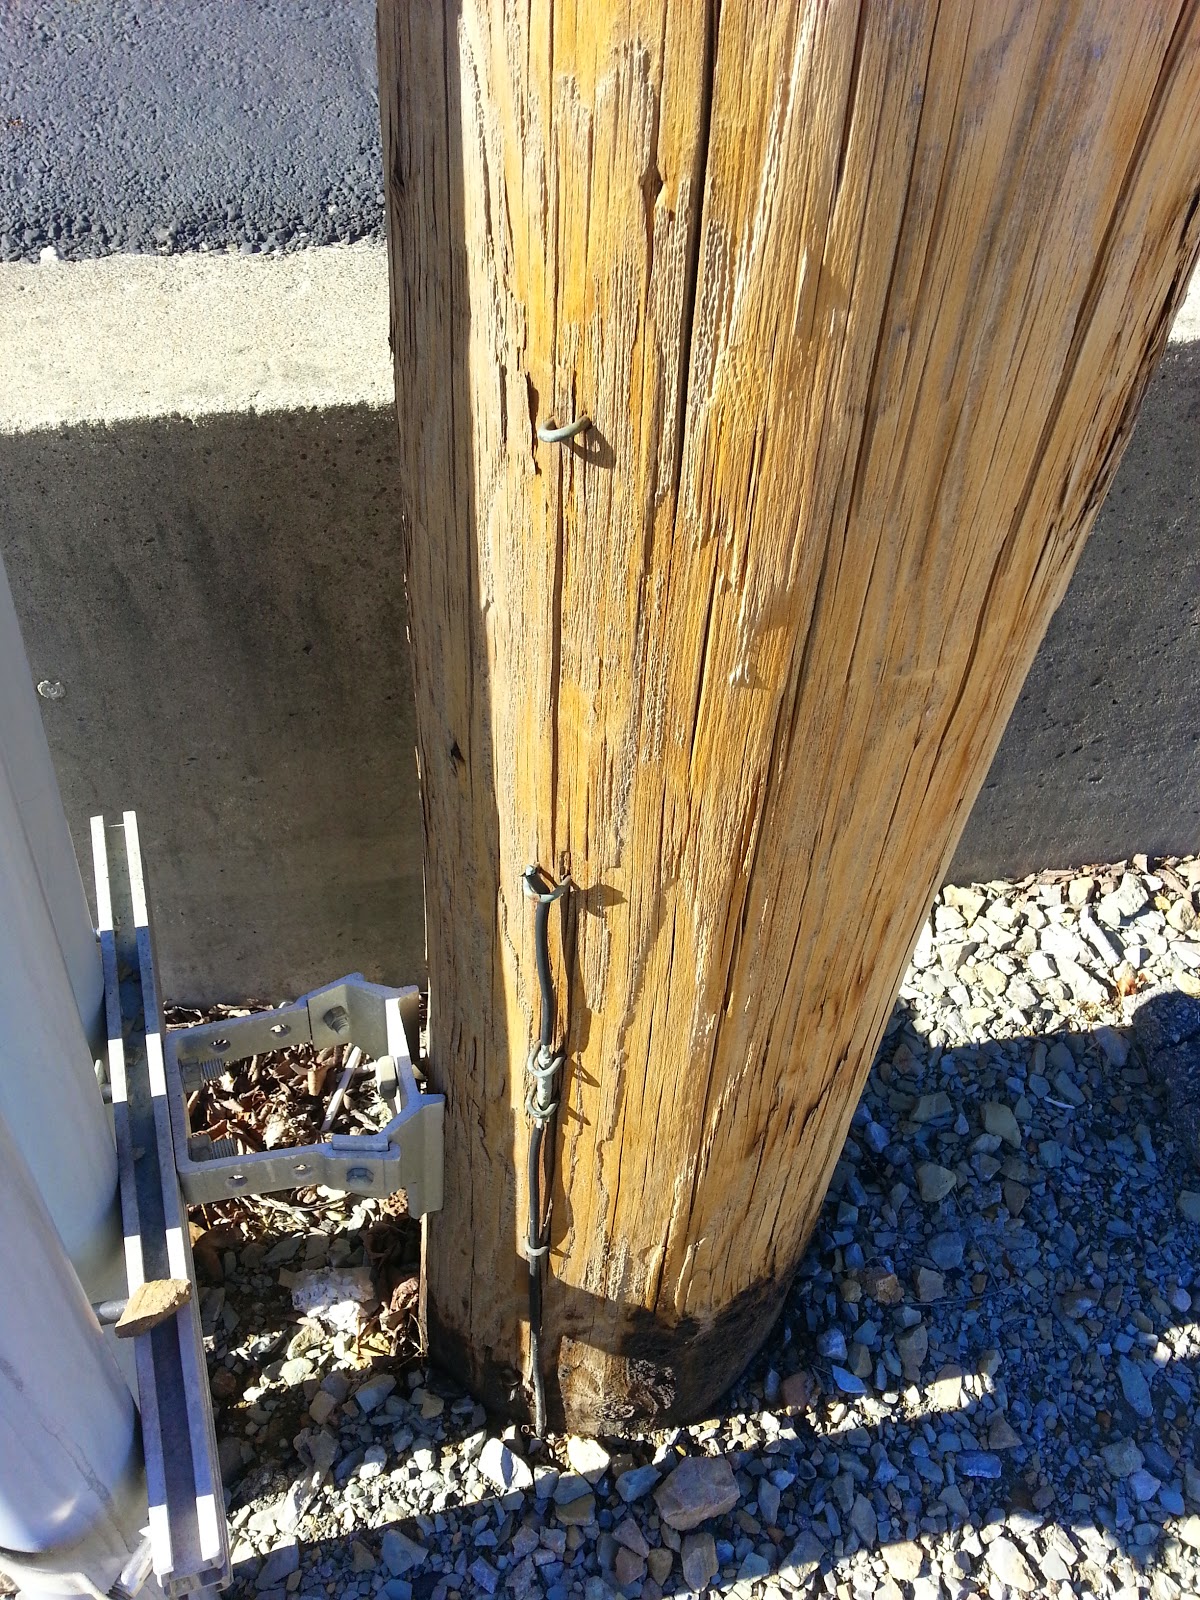
The noise appears to be coming from a faulty and unsafe power pole near a local school. He writes that the power poles primary ground line has been severed and that a wire from the AC line is simply dangling in the air, ready to be grabbed by school children.
Heatmap showing sources of powerline interferenceThe faulty power pole with dangling AC lineSevered grounding line
Tim’s system uses a powerful Odroid XU3 which is a Linux based mini embedded computer that sells for $179 USD. The Odroid XU3 has dual quad core ARM CPUs which is enough power to run rtl_power with 5 RTL-SDR dongles simultaneously. Rtl_power is an RTL-SDR tool which allows you to scan and record the power levels in the frequency spectrum. By using 5 dongles he is able to scan the 49 MHz, 50 MHz, 144 MHz, 222 MHz and 432 MHz bands simultaneously.
The idea behind this project is to be able to MAP real-world Geo-tagged noise floor readings. This can be used for the primary purpose I intended for this application (mapping of problematic sources of RF Noise related to power lines in the area so that I can approach the local power company to resolve them) or any other sort of RF signal MAPPING. Such as cellphone/cellsite coverage or FM broadcast coverage (and dead spots) among other things.
RTL dongles are CHEAP, and reliable, although not 100% stable (they drift a bit for the first 5 minutes of warm up) they can be used to measure changes in the RF Noise Floor (once warmed up). While they don’t really seem to be able to be calibrated to anything less than -87db all we’re really looking for are relative changes to the noise floor while driving around a particular location (there is probably some complex math that could applied to these measurements that could be calibrated). So for this project these inexpensive receivers are really just fine.
While rtl_power is scanning, the Odroid uses a GPS receiver to tag the timestamped noise readings with GPS coordinates. Then by driving around with the system and combining the GPS coordinates with the noise floor readings from rtl_power he is able to create a heatmap showing exactly where in his neighbourhood noise levels peak, indicating a power line RF noise problem to be fixed by the power company.
Some more information about the hardware build of his system can be found on a previous post.
Powerline Noise Heat Mapped with RTL-SDRs and GPS LoggingThe insides of the driveby system
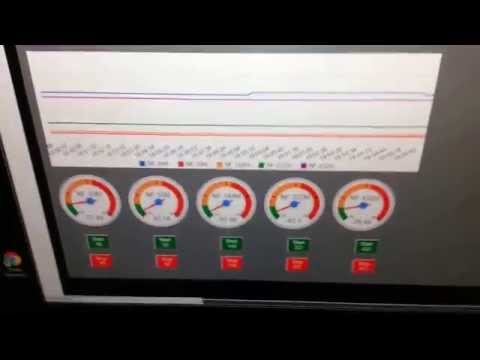
Tim also has uploaded a video to YouTube showing his system running a stationary test demonstrating the hardware and some of his custom software before everything was boxed up.