Tagged: rtl_power

New software rtl_heatmap: Web based waterfall plotter for rtl_power

Over on GitHub a new heatmap plotter for rtl_power has been released. The software is called rtl_heatmap and is software that can be used to create a heatmap from the csv data produced by rtl_power. The software creates the heatmap and also adds frequency marker information to the plot. Rtl_heatmap is written in JS and HTML5 and is a web browser based app.

Rtl_power is a tool that can scan a large chunk of bandwidth with an RTL-SDR dongle and record signal power levels over time.

A demo of the software in action can be found at http://heat.wq.lc/.

rtl_heatmap is a web based heatmap plotter for rtl_power

RTL_POWER Instructions

A new instructional page for the rtl_power tool is now available on main author keenerds webpage. Rtl_power is a command line tool for logging wide band frequency power scans to a CSV file. The CSV files can then be used for analysis or to create a large frequency plot image. An example of a 2 GHz+ bandwidth scan over 24 hours is shown below. Rtl_power is available as part of the official osmocom RTL-SDR drivers.

Example scan over an E4000 dongles entire frequency range.

Automatic Heatmap Logging on a Raspberry Pi using an RTL-SDR and RTL_POWER

Amateur radio hobbyist DE8MSH recently wrote in to let us know about a project he has been working on. His project involves using a Raspberry Pi B and RTL-SDR to automatically log a wide band heatmap using rtl_power. Rtl_power is a command line tool that will log signal strengths to a csv file using the RTL-SDR over a very large definable bandwidth.

To do the automatic logging the Raspberry Pi runs rtl_power for 23 hours constantly writing data to a mounted hard drive. After 23 hours the heatmap image is calculated and then uploaded to a webpage at http://qth.at/de8msh/listheatmaps.php. The scheduling is performed by a cron job.

DE8MSH has also been working on a second related project over at http://www.qth.at/de8msh/hm/pic.html. The heatmap on this page shows various transmissions from weather balloons. As you mouse over those transmissions, the QTH (location) of those weather balloon transmissions is shown as well as the frequency and time of where the mouse pointer currently is.

Raspberry Pi Automatic Heatmap Logging with rtl_power

New Command Line Utility: rtl_power

A new command line wideband spectrum monitor utility called ‘rtl_power’ has been released by keenerd on Reddit. See the original thread here. This tool let’s you gather signal data over a very wide area of the frequency spectrum, and then that data can be used to find active areas of the spectrum.

Rtl_power is a small CLI tool for logging wide swaths of bandwidth. You can specify any chunk of spectrum, with any FFT bin size and any logging rate. (For sane values of any.)

For example

rtl_power -f 150M:200M:2k -i 10 logfile.csv

will monitor everything between 150MHz and 200MHz. The resolution will be at least 2kHz fine. It will integrate for 10 seconds and dump those numbers to the logfile. The structure of the logfile is:

date, time, Hz low, Hz high, Hz step, samples, dbm, dbm, ...

So it is not quite the traditional CSV file. Each frequency hop gets its own line and the frequencies of each column are extrapolated.

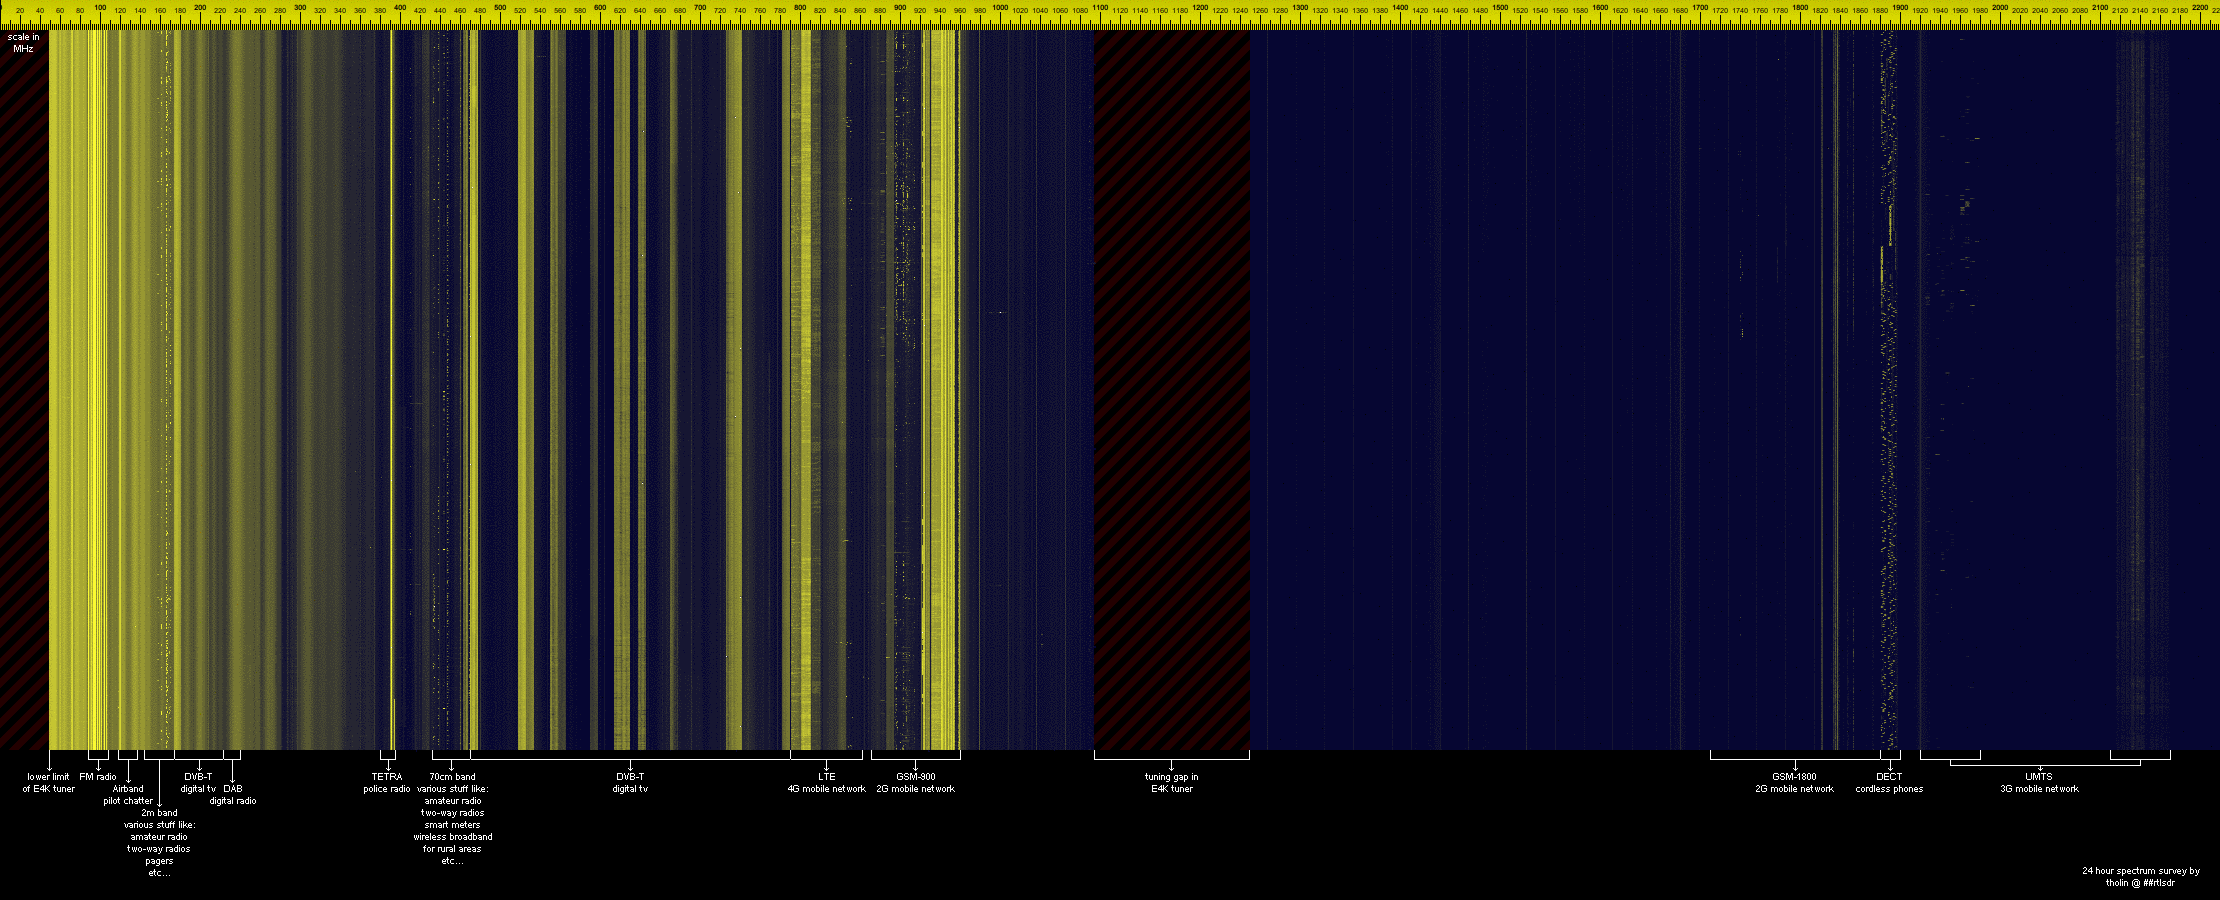
Coupled with a python script, a heatmap can be generated from the excel data.

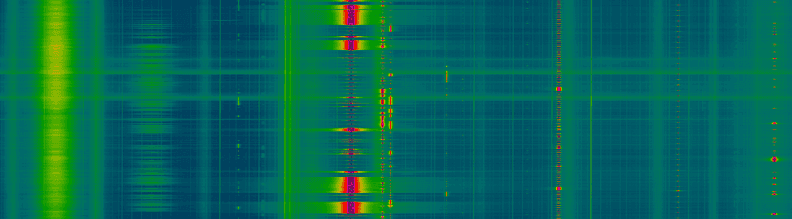
I’m scanning the region between 150MHz and 160MHz, where there is local emergency services chatter. Each pixel is 10kHz wide and 10 seconds long, over a period of seven hours

rtl_power heatmap

This is command line tool is somewhat similar to the Scanner Metrics SDRSharp plugin, which allows large areas of the frequency spectrum to be monitored from within SDRSharp.