Tagged: heatmap

Fingerprinting Electronic Devices via their RF Emissions with an RTL-SDR and ImageMagick

Thank you to José Carlos Rueda for submitting his simple shell script that he uses for fingerprinting spurious RF emissions with an RTL-SDR, rtl_power, heatmap.py and imagemagick. The result is something like Disney's EM sense created with much simpler code.

It is well known that almost all electronic devices unintentionally emit unique spurious RF signals when in operation. By using an SDR like an RTL-SDR to record the spectra from electronic devices, it's possible to build up a database of known emissions. We can then detect when an electronic device is active by comparing the live spectrum to spectra stored in the database.

In a previous post we covered Disney's EM sense which is an experimental smart watch that automatically detects what electronic device the wearer is touching. With EM Sense they use an RTL-SDR and a database of raw pre-recorded spectrum data. To detect what the wearer is touching the live signal from the RTL-SDR is correlated against the database, and the closest match is returned.

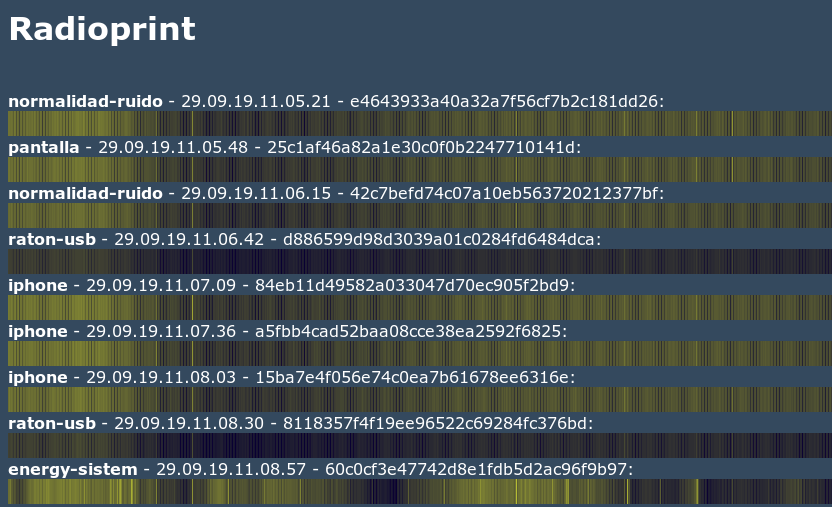
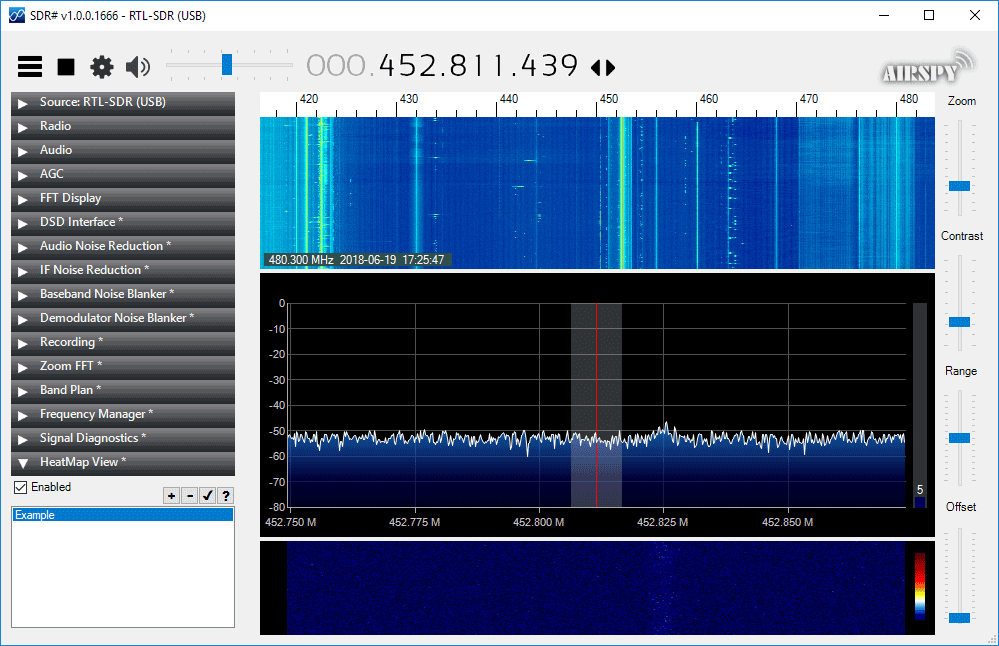
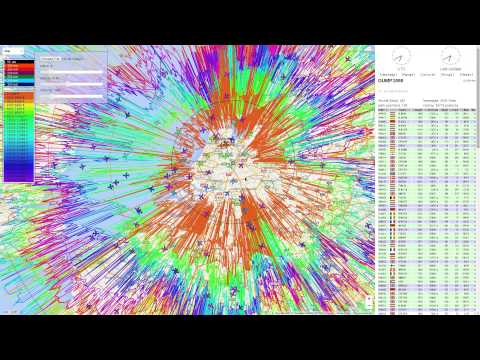
José's script does something very similar, however instead of correlating with raw spectrum data he instead uses the waterfall image that is generated by rtl_power and heatmap.py. The rtl_power program allows an RTL-SDR to scan the frequency spectrum over a wider bandwidth by rapidly scanning ~2.4 MHz chunks of bandwidth at different frequencies. Heatmap.py is a program that turns the scanned data from rtl_power into a heatmap image of the spectrum.

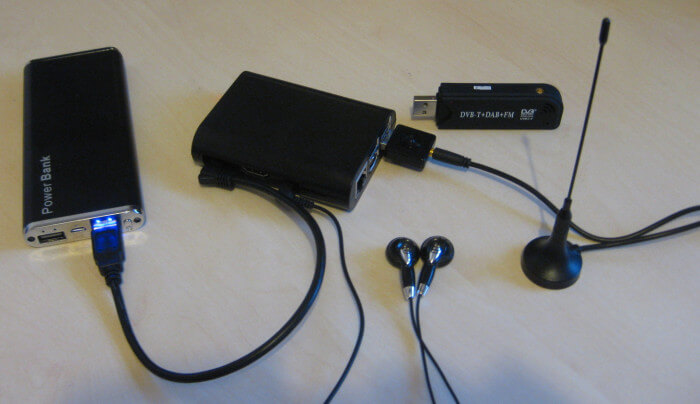
To add an entry to the database, the electronic device is placed 7-8 centimeters away from the RTL-SDR, and a heatmap image recorded between 24 - 921 MHz is saved to disk. This can be repeated for multiple electronic devices. Each image will record the spurious signals from the electronic device, resulting in a unique heatmap image per electronic device.

Once the database has been created, you can then place any of the devices found in the database next to the RTL-SDR, and record a heatmap for 20-30s. That heatmap will then be compared against the images in the database using imagemagick which is an image analysis and manipulation library. The electronic device associated with the closest matching image in the database will be returned.

In his experiments he tested various electronic devices like an iPhone and was able to successfully determine when it was nearby.

Various electronic device spectra waterfall images recorded in the database

Using an RTL-SDR and OpenCV To Create an EMI Heatmap of Circuit Boards

Over on YouTube and his blog user Charles Grassin has uploaded a short video and blog post showing how he's using an RTL-SDR EMI (electromagnetic interference) probe and OpenCV to create a visual EMI heatmap.

Earlier this month we posted about Dmitris' experiments in which he was able to create a home made EMI/EMC probe out of a loop of semi-rigid coax and an RTL-SDR V3. This type of probe is useful for determining what components or areas on a circuit board are emitting electromagnetic interference. EMI testing for PCBs may be critical for passing compliance tests.

Charles' project takes the RTL-SDR EMI probe idea a step further by combining it with OpenCV. OpenCV is an open source library of code for computer vision applications. With the EMI data generated by the RTL-SDR EMI probe, and a camera pointed at a PCB, Charles is able to overlay a heatmap on top of the visual image which reveals the EMI hot spots on a PCB.

The video below shows the EMI heatmap of an Arduino PCB being mapped out. His blog post shows some other examples like a keyboard and a hairpin RF filter. The code he's created is open source and available on his EMI_Mapper GitHub page.

EMI mapping (OpenCV and RTL-SDR)

New RTL-SDR Frequency Heatmap Generator Plugin for SDR#

Thanks to VE3NEA for letting us know about his new RTL-SDR compatible heatmap generator plugin for SDR#. To use the plugin you first need to generate some heatmap CSV data by using the rtl_power software. You can then open the CSV file in the plugin and it will generate a heatmap image. A frequency heatmap shows a wideband waterfall image of detected frequency activity.

RTL-SDR heatmap tools are nothing new, but the convenience of having it as a SDR# plugin is that you can click on the heatmap image to instantly tune to a frequency where activity was recorded during the initial rtl_power scan.

SDRSharp RTL-SDR Heatmap Plugin

Generating a WiFi Radio Heatmap with a Helical Antenna, Antenna Rotator and a HackRF

Over on YouTube The Thought Emporium channel has been working on creating a "WiFi Camera" over the past few weeks. The idea is to essentially create a small radio telescope that can "see" WiFi signals, by generating a heatmap of WiFi signal strength. This is done with a directional helical 2.4 GHz antenna and motorized rotator that incrementally steps the antenna through various angles. After each movement step a HackRF and Python script is used to measure WiFi signal strength for a brief moment, and then the rotator moves onto the next angle. The helical antenna and rotator that they created are made out of PVC pipe plastic and wood, and are designed to be built by anyone with basic workshop tools like a bandsaw.

The final results show that they've been able to successfully generate heatmaps that can be overlaid on top of a photo. The areas that show higher signal strength correlate with areas on the photo where WiFi routers are placed, so the results appear to be accurate. In the future they hope to expand this idea and create a skyward pointing radio telescope for generating images of the galactic hydrogen line, and of satellites.

WiFi Heatmap Building Scan Results
The Thought Emporiums' WiFi Heatmap Building Scan Results

The videos are split into three parts. The first two videos show the build process of the antennas and rotator, whilst the third video shows the final results.

DIY Radio Telescope Version 2: Wifi vision - Part 1

The Angriest Radio Telescope - Wifi Camera Part 2

Building a Camera That Can See Wifi | Part 3 SUCCESS!

Detecting Car Keyfob Jamming With a Raspberry Pi and RTL-SDR

It’s been known for a while now that it is possible to break into cars using simple wireless attacks that involve jamming of the car keyfob frequency. Sammy Kamkars “rolljam” is one such example that can be built with a cheap Arduino and RF transceiver chip. One way to secure yourself against wireless attacks like this is to run a jammer detector.

A jammer detector is quite simple in theory – just continuously measure the signal strength at the car keyfob frequency and notify the user if a strong continuous signal is detected. Over on his blog author mikeh69 has posted about his work in creating a wireless jammer detector out of a Raspberry Pi and RTL-SDR dongle. He uses a Python script and some C code that he developed to create a tool that displays the signal strength on an onscreen bar graph and also conveys signal strength information via audio tones. He writes that with a pair of earphones and battery pack you can use the system while walking around searching for the source of a jammer.

Mikeh69’s post goes into further detail about installing the software and required dependencies. He also writes that in the future he wants to experiment with creating large area surveys by logging signal strength data against GPS locations to generate a heatmap. If you are interested in that idea, then it is similar to Tim Haven’s driveby noise detector system which also used RTL-SDR dongles, or the heatmap feature in RTLSDR Scanner.

[Also seen on Hackaday]

RTL-SDR + Raspberry Pi Jammer Detector.

A modified dump1090 with ADS-B Heatmap and Range Alititude View

Dump1090 is one of the most popular ADS-B decoders that is used together with the RTL-SDR dongle. ADS-B stands for Automatic Dependant Surveillance Broadcast and is a system used by aircraft that broadcasts their GPS positions. It is a replacement for traditional reflection based radar systems. We have a tutorial on using the RTL-SDR to decode ADS-B here.

There is now a forked version of dump1090 by tedsluis that incorporates heatmap generation and range/altitude view. A heatmap will allow you to visualize where the most active aircraft paths in your area are and the range/altitude view allows you to see at what altitudes aircraft typically fly at in different locations. The software logs aircraft data in a CSV file, and then after collecting enough data a second program can be used to generate the heatmap. The full explanation of the software and instructions for installing and using it on a Raspberry Pi Linux system together with PiAware are posted on the flightaware.com forums.

A heatmap of aircraft flight paths.
dump1090-mutability with Heatmap ADS-B and range altitude view

RTL-gopow: New heat map tool

Rtl_power is a tool that allows you to create wide band signal strength heat maps over a long length of time. It works by very quickly hopping across the spectrum, capturing the RTL-SDR bandwidth of about 2 MHz at a time, and then displaying it on a heat map. This is useful for seeing what frequencies are active and at what times. 

Usually to obtain a heat map with rtl_power you need to record the data first, and then pass it through a Python program called heatmap.py which creates the heat map image file. Now there is rtl_gopow which is a new program that directly creates a PNG heat map file from an rtl_power sweep. It is currently available for OSX, Linux, Linux ARM, and Windows.

You can download the binary releases here.

2.5 hour long heat map generated by RTL_GOPOW

New software rtl_heatmap: Web based waterfall plotter for rtl_power

Over on GitHub a new heatmap plotter for rtl_power has been released. The software is called rtl_heatmap and is software that can be used to create a heatmap from the csv data produced by rtl_power. The software creates the heatmap and also adds frequency marker information to the plot. Rtl_heatmap is written in JS and HTML5 and is a web browser based app.

Rtl_power is a tool that can scan a large chunk of bandwidth with an RTL-SDR dongle and record signal power levels over time.

A demo of the software in action can be found at http://heat.wq.lc/.

rtl_heatmap is a web based heatmap plotter for rtl_power