This week on the SignalsEverywhere YouTube channel Sarah shows how to install the "Retrogram" software. This is a command line 'retro' styled spectrum analyzer designed to be used with the PlutoSDR. The software makes use of ASCII art to display the spectrum, meaning that a spectrum can be viewed directly in an SSH terminal, without any GUI.
In the video Sarah goes through the steps to install the software before demonstrating it in action.
Retrogram - A Command Line Spectrum Analyzer For The PlutoSDR
Back in March last year we first posted about the release of SATSAGEN, and program by Alberto (IU1KVL) that allowed the PlutoSDR to work as a spectrum analyzer. SATSAGEN has recently been updated to version 0.5, and it now supports the RTL-SDR, HackRF and Simple Spectrum Analyzer hardware as well.
Spectrum analyzer software allows you to monitor spectrum activity over a bandwidth much larger than what your SDR supports. It works by rapidly sweeping over multiple frequencies and stitching the spectrum slices together.
Some highlights of the new features include:
Works with:
ADALM-PLUTO
HackRF One
RTL-SDR Dongles
Simple Spectrum Analyzer series like NWT4000, D6 JTGP-1033, Simple Spectrum Analyzer, and so on.
Video trigger, real-time trigger, and fast-cycle feature
ADALM-PLUTO custom gain table and Extended linearization table for all devices
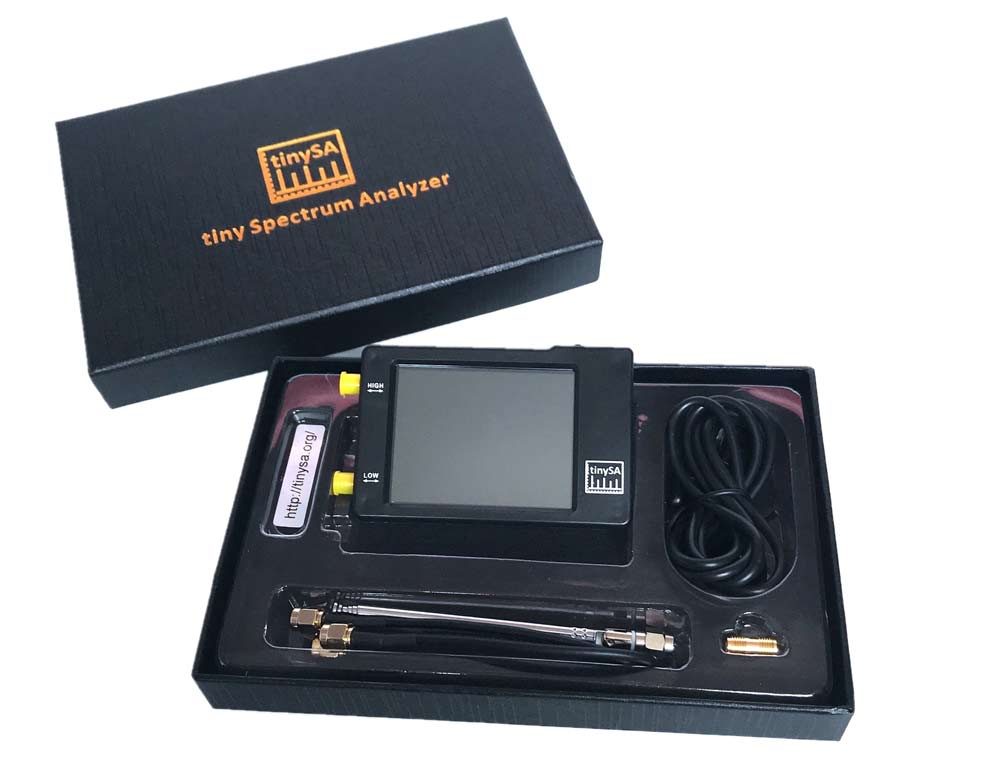
Thank you to a few readers for suggesting a post about the "tinySA". The tinySA is a low cost standalone spectrum analyzer which was made recently available from Chinese manufacturer "Hugen" who was the manufacturer that popularized the original NanoVNA. It can be found on Aliexpress for about $49 shipped worldwide. R&L also have US based stock available. The official specs from tinysa.org/wiki read:
Spectrum Analyzer with two inputs, high quality MF/HF/VHF input for 0.1MHZ-350MHz, lesser quality UHF input for 240MHz-960MHz.
Switchable resolution bandpass filters for both ranges between 2.6kHz and 640kHz
Color display showing 290 scan points covering up to the full low or high frequency range.
Input Step attenuator from 0dB to 31dB for the MF/HF/VHF input.
When not used as Spectrum Analyzer it can be used as Signal Generator, MF/HF/VHF sinus output between 0.1MHZ-350MHz, UHF square wave output between 240MHz-960MHz.
A built-in calibration signal generator that is used for automatic self test and low input calibration.
Connected to a PC via USB it becomes a PC controlled Spectrum Analyzer
Rechargeable battery allowing a minimum of at least 2 hours portable use
A spectrum analyzer allows you to view a defined slice of the frequency spectrum on a graph. It does not allow for demodulation of signals. We note that SDRs like the RTL-SDR could be used as a spectrum analyzer too with software like QSpectrumAnalzyer and Spektrum, however the advantage of the tinySA is that it is a standalone package with it's own screen that can easily be used in the field. Unlike an SDR extra computing devices like a computer or smartphone are not required.
Over on YouTube IMSAI Guy has been uploading a few videos reviewing the tinySA. From his videos he found a few issues including a slow update rate, harmonics and high phase noise. However, later he finds that most of the harmonic issues disappear as long as the input signal level is kept below -30dBm. In some more recent videos he also finds a fault with the attenuator chip on one of his tinySA units and repairs it by replacing the chip.
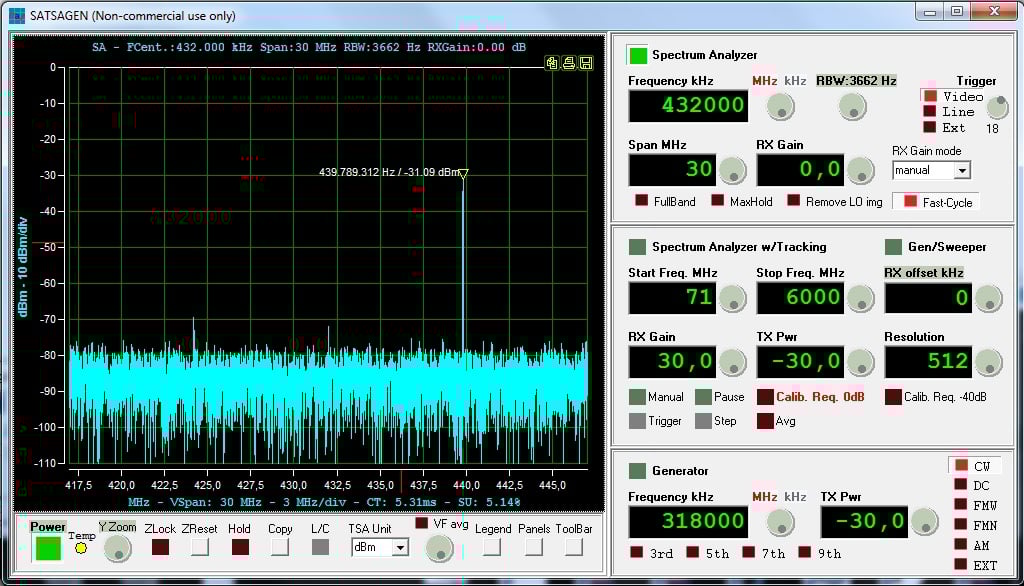
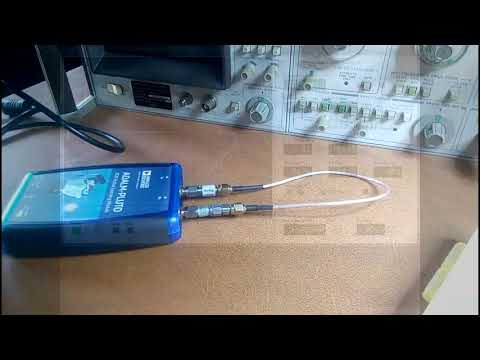
Thank you to Frank, HB9FXQ for submitting news about a new Windows program called SATSAGEN which allows you to use a PlutoSDR as a wideband spectrum analyzer. SATSAGEN was created by Alberto IU1KVL and is entirely free to use. This makes it possible to get wideband scans of RF components like filters and attenuators. Together with a directional coupler it could also be used to measure the SWR of antennas as HB9FXQ demonstrates in his Twitter post.
The PlutoSDR is a low cost RX/TX capable SDR with up to 56 MHz of bandwidth and 70 MHz to 6 GHz frequency range. It is typically priced anywhere between US$99 - US$149 depending on sales.
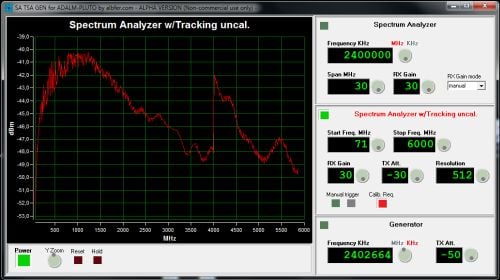
In the video below Alberto demonstrates SATSAGEN performing some wideband scans, and he shows the various features of the software. He writes that the system has a scan range from 70 MHz to 6 GHz and can show results in dBm. The spectrum analyzer works with the TX part of the PlutoSDR to provide a tracking generator with resolution of up to 1024 points. The software can also use the PlutoSDR as a frequency generator with 1 kHz of resolution.
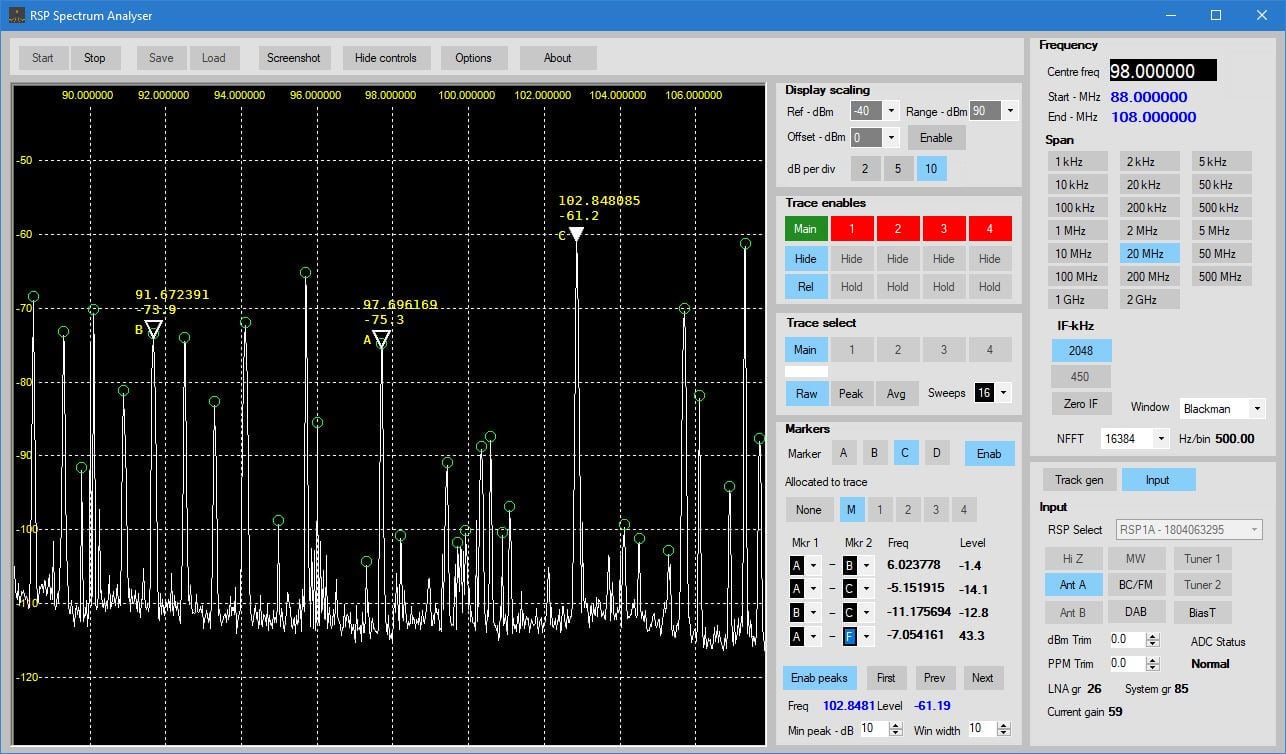
Steve Andrew, the author of the SDRplay Spectrum Analyzer software has recently released an update which enables several new features. This software allows you to use SDRplay SDRs to scan a wide swath of bandwidth by rapidly scanning in 10 MHz (or less) chunks over the SDRplay's frequency range. The SDRplay team write:
We are pleased to announce the availability of V1.0a of the Spectrum Analyser software developed by Steve Andrew specifically for the RSP line of products. This is a very-much upgraded version of the original alpha release and includes many new features as well as removing the limitations imposed on the previous version. New features include multiple traces, a versatile marker system with maths, peak find and display functions, Zero or non-Zero IF options and an upgraded tracking generator system. Currently support are:
Over on GitHub, Rakesh Peter (r4d10n) has uploaded a new terminal/ssh based console application called "retrogram~rtlsdr". This program uses an RTL-SDR and terminal window to display a spectrum analyzer drawn in ASCII art. Because it is terminal based, it is even possible to view the spectrum of a remote device over an SSH connection. The program is based on software designed for Ettus USRP SDRs, and has been adapted for RTL-SDR.
For other SDRs r4d10n has also worked on a "retrogram~soapysdr" version which should work with any SoapySDR compatible SDR, and "retrogram~plutosdr" for PlutoSDR SDRs.
Spektrum is a popular spectrum analyzer program that is used with RTL-SDR dongles. It is based on the command line rtl_power software and is compatible with both Windows and Linux. Thanks to it's easy to use GUI it is an excellent piece of software for scanning and determining where active signals exist, or for measuring filters and antenna SWR with a noise source.
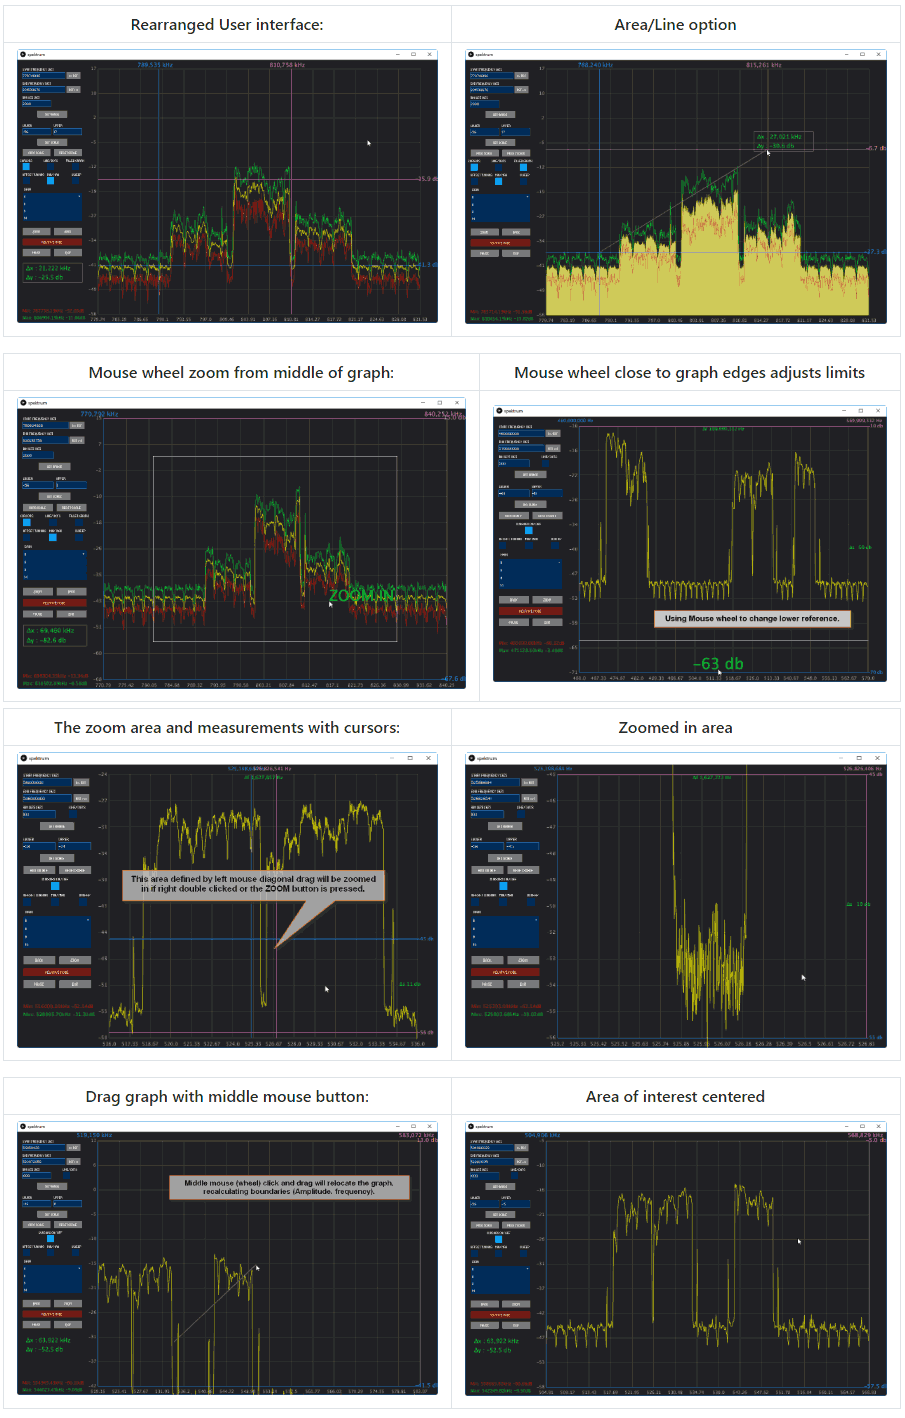
Recently SV8ARJ (George) and SV1SGK (Nick) have been working on extending the original open source Spektrum code. Their improvements focus around the UI and making it more functional and easier to use. Currently the updated branch is in alpha, and they are hoping that any testers could help report bugs, issues and wishes to them. The code is available on their GitHub and the latest Windows test build can be downloaded from their DropBox.
The changelog reads:
2 Cursors for Frequency axis.
2 Cursors for Amplitude axis.
Absolute and differential measurements with cursors.
Zoom functionality of the cursors's defined area (gain + frequency).
Mouse Wheel Gain adjustment on graph (Top area for upper, low area for lower).
Mouse Wheel Frequency adjustment on graph (left area for lower frequency, right for upper).
Mouse Wheel in the centrer of the graph performs symetric zoom in/out.
View/settings store/recall (elementary "back" operation, nice for quick zoomed in graph inspection).
Right click positions primary cursors.
Right Double Click positions primary cursors and moves secondary out of the way.
Left Double Click zooms area defined by cursors (Amplitude + frequency).
Left Mouse Click and Drag on a cursor moves the cursor.
Middle (mouse wheel) Double Click resets full scale for Amplitude and Frequency.
Middle (mouse wheel) Click and Drag, moves the graph recalculating limits accordingly.
Reset buttons to Min/Max range next to Start and Stop frequency text boxes.
Cursor on/off checkbox now operate on all 4 cursors.
ZOOM and BACK buttons.
Filled-in graph option (line or area).
Display of frequency, Amplitude and differences for all cursors.
Modified: Button layout.
Fixed: Save/Reload settings on exit/start. IMPORTANT : delete the "data" folder from the installation location if you have it.
Steve Andrew has just released an alpha version of a Windows Spectrum Analyzer app for SDRplay SDRs that he's been working on. The app is currently still in alpha, meaning that all the features are not yet implemented. In particular, scans larger than the SDRplay's maximum bandwidth of 10 MHz are not ready yet. In the future the app will be able to scan swath's of bandwidth up to 2 GHz wide, similar to what SpectrumSpy for the Airspy and rtl_power for the RTL-SDR does.
We are pleased to announce the availability of the first cut of Spectrum Analyser software developed by Steve Andrew specifically for the RSP line of products. Please note that this is first alpha software and so it is still very much in development and some features are still to be added. Currently supported are:
RSP1 RSP2/RSP2pro RSP1A
This first alpha release gives a good idea as to the look and feel for the software. The main functional limitation is that sweeps of greater than 10 MHz are not currently supported. Steve is currently re-working the algorithms for providing wider sweeps than 10 MHz to improve sweep time and remove the issue of the DC spike in ZIF mode, so please bear with him.
We recommend using the software with AGC turned off and use manual control of the gain for better display stability.
Please use this forum thread to post any issues. Read the issues already raised and only post if the issue you have found hasn’t been raised. This will help Steve in his development.
Further development information can be found on the forum.