Pseudo-Doppler Direction Finding with a HackRF and Opera Cake
Last week we posted about Micheal Ossmann and Schuyler St. Leger's talk on Pseudo-Doppler direction finding with the HackRF. The talk was streamed live from Schmoocon 18, but there doesn't seem to be an recorded version of the talk available as of yet. However, Hackaday have written up a decent summary of their talk.
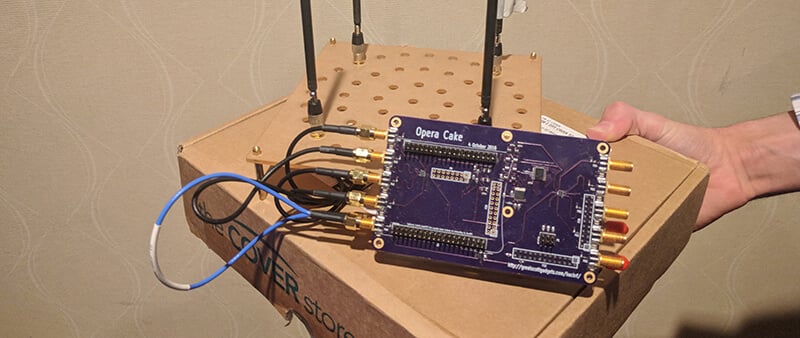
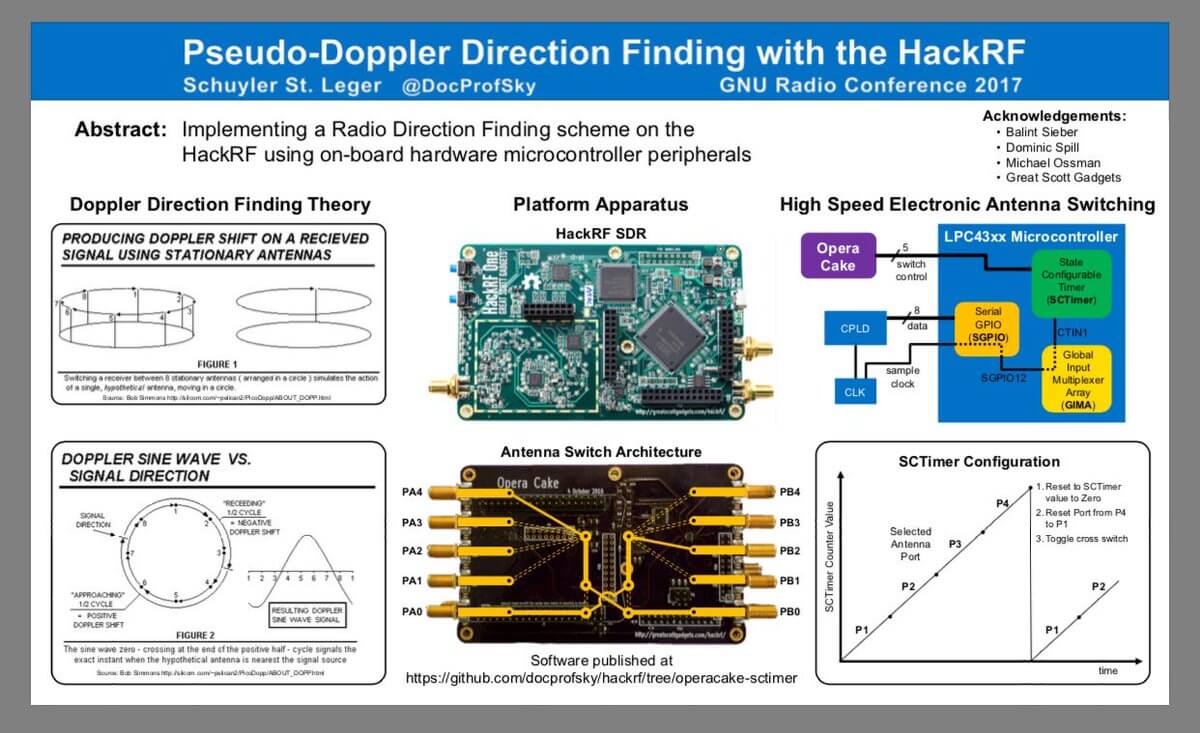
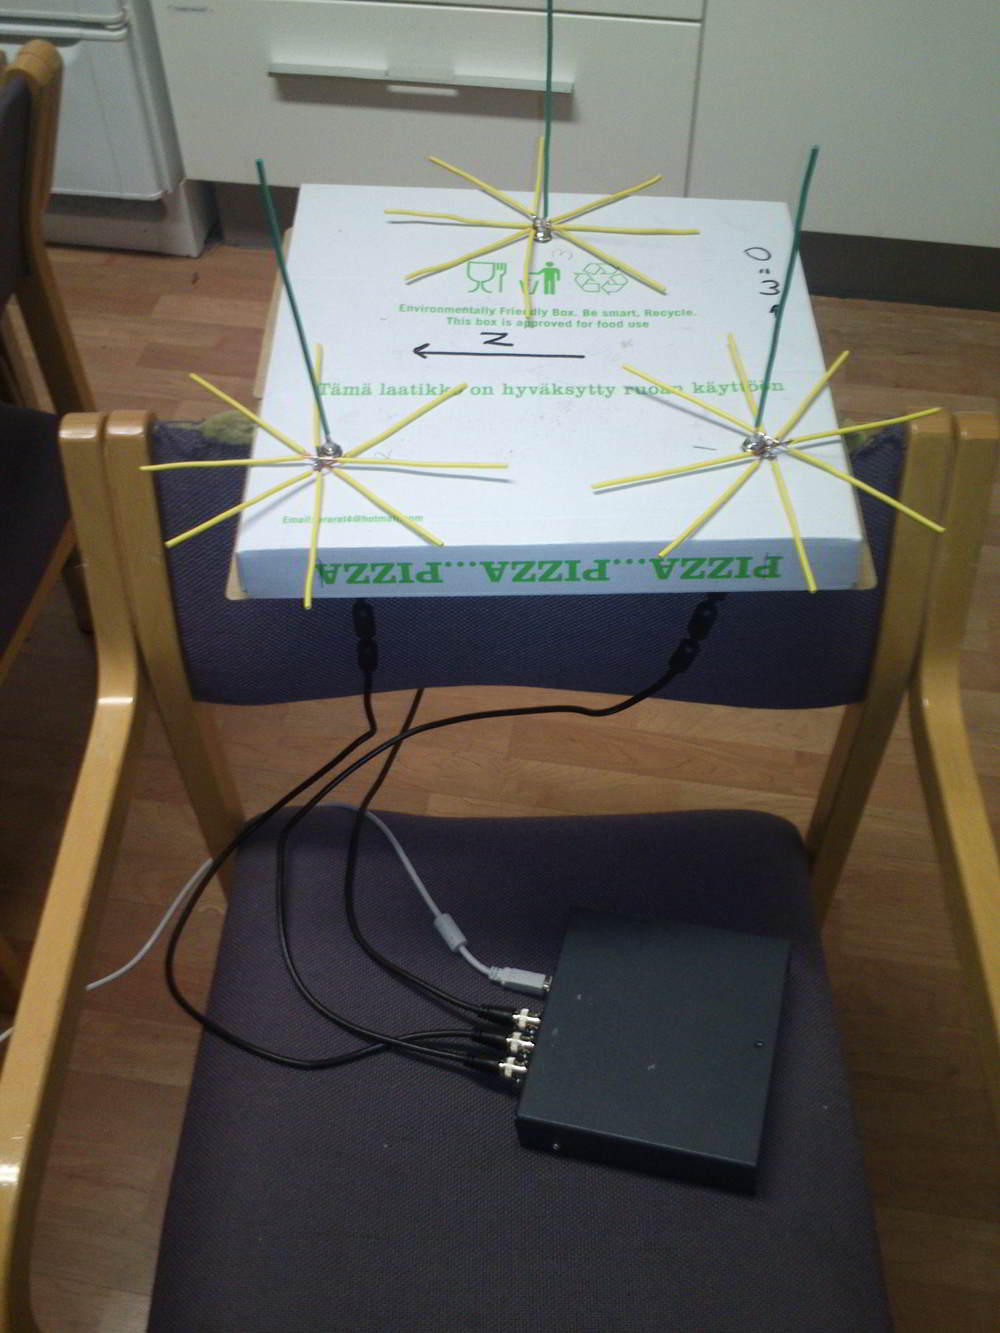
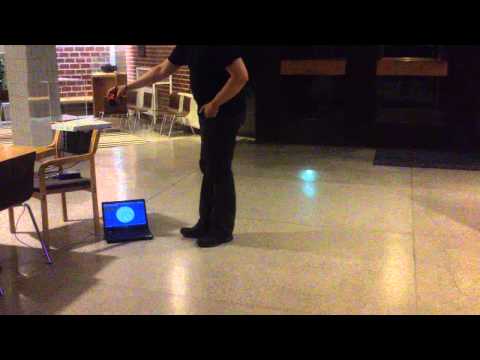
In their direction finding experiments they use the 'Opera Cake' add-on board for the HackRF, which is essentially an antenna switcher board. It allows you to connect multiple antennas to it, and choose which antenna you want to listen to. By connecting several of the same type of antennas to the Opera Cake and spacing them out in a square, pseudo-doppler measurements can be taken by quickly switching between each antenna. During the presentation they were able to demonstrate their setup by finding the direction of the microphone used in the talk.
If/when the talk is released for viewing we will be sure to post it on the blog for those who are interested.