This was posted over on our Discovery Dish Crowd Supply updates page and we are cross-posting here too.
It’s been over a month since our last update so we thought we’d share some of the recent progress. As mentioned in our last update, during the month of February all manufacturing was shut down due to the Chinese New Year holiday. In early March, staff returned to the factories and began making progress on finishing Discovery Dish.
New Logo!
We have a snazzy new logo, and we are working on obtaining some stickers to include with the feeds.
Dish Manufacturing Progress
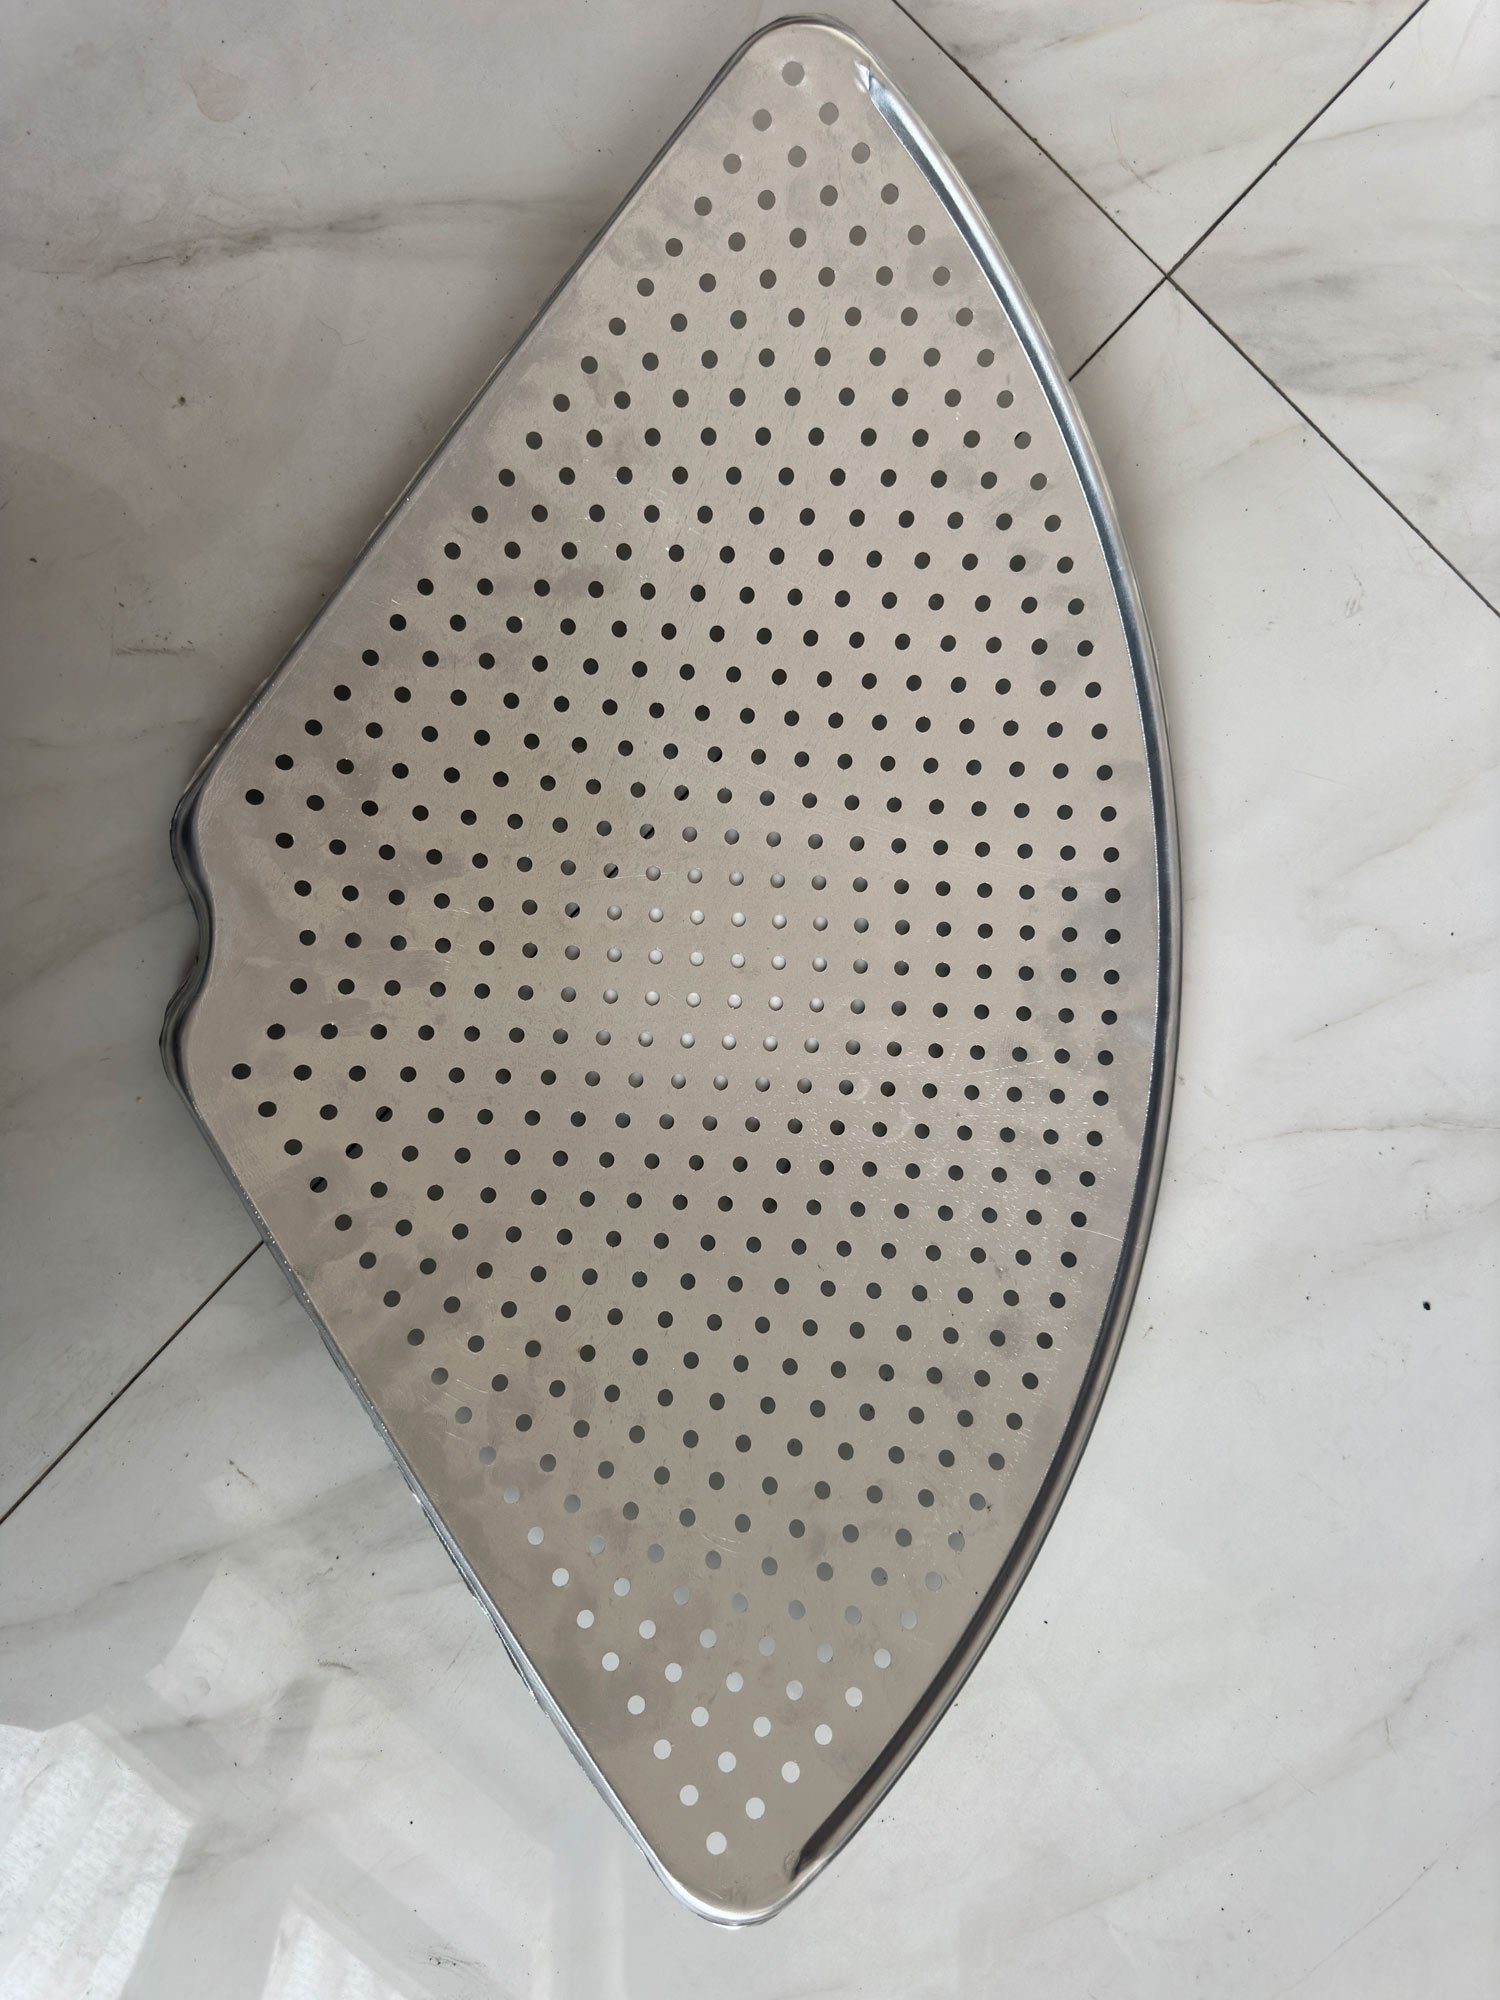
The molds for the dish stamping machine were successfully created in March and the test stamps have come out great. The manufacturer is still tweaking the secondary mold that stamps the mounting and connecting holes, but we expect that to be completed shortly. Once that is done and tested, we can begin stamping the dish segments en masse.
The Dish mounting system was also finalized and we added 45-degree markers to it, which can help with aligning skew.
We are still awaiting the results of the anodizing tests, but they should be completed by the end of this month. Anodizing the dish is important as the dish must be a dark non-reflective matte color, so that it does not focus hot sunlight onto the feed point plastic head.
Feed Manufacturing Progress
PCB Upgrades
While waiting for the manufacturers to finish up with the molds, we’ve been further refining the PCB feed. Our final version of the PCB has now moved to a PTFE substrate with significantly lower loss at higher frequencies. This has yielded an over 1 dB increase in SNR at the GOES 1.69 MHz frequency.
The change to PTFE was not without problems. An interesting RF engineering problem occurred with the move to PTFE that we wanted to share. When moving to PTFE the only changes to the board layout are PCB trace width changes to keep the impedances matched. Other than that, the boards and layout are essentially identical. However, we discovered that the dual LNA design started oscillating when we moved the PTFE substrate. Oscillations can occur with LNAs when RF essentially bounces back and forth between the two LNAs, which causes undefined behavior in the LNA, such as poor gain, multiple spikes in the spectrum, and unexpected current draw values.
We found this quite odd because oscillations were not occurring in the original FR4 PCB, and the QPL9547 LNA is advertised as ‘unconditionally stable’ which means that it should never oscillate. However, we found that unconditionally stable guarantees may not apply to two-stage designs. In the end, the fix was simple, we just needed to add a damping resistor to one of the inductors on the circuit which reduces its Q-value. It seems that the change from FR4 to PTFE effectively increased the Q-value of this inductor so much, which in turn induced an oscillation in the circuit.
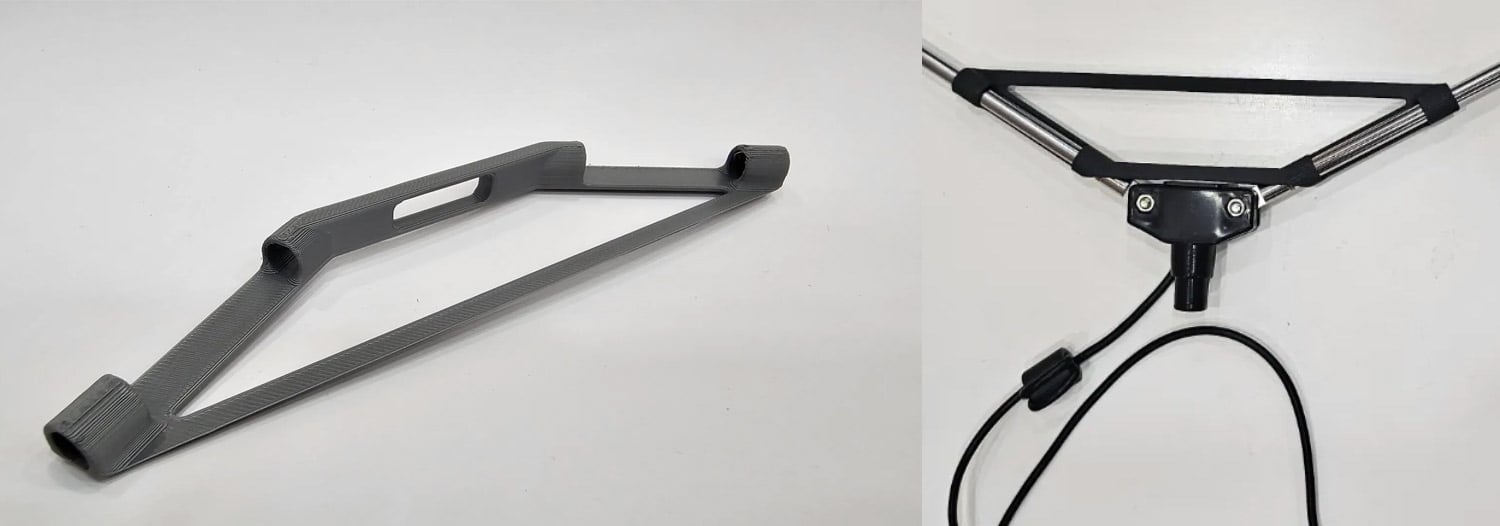
Discovery Dish Feed Head Enclosure
We’ve also refined the entire feed assembly. The feed arm pipe now has a ruler laser etched onto it so that mounting it at the correct distance is easy. A skew angle guide has also been added around the neck. A thumbscrew locking mechanism has been added to the feed head neck too, so that skew can easily be adjusted without the need for a screw driver or Allen wrench to loosen the set screw.
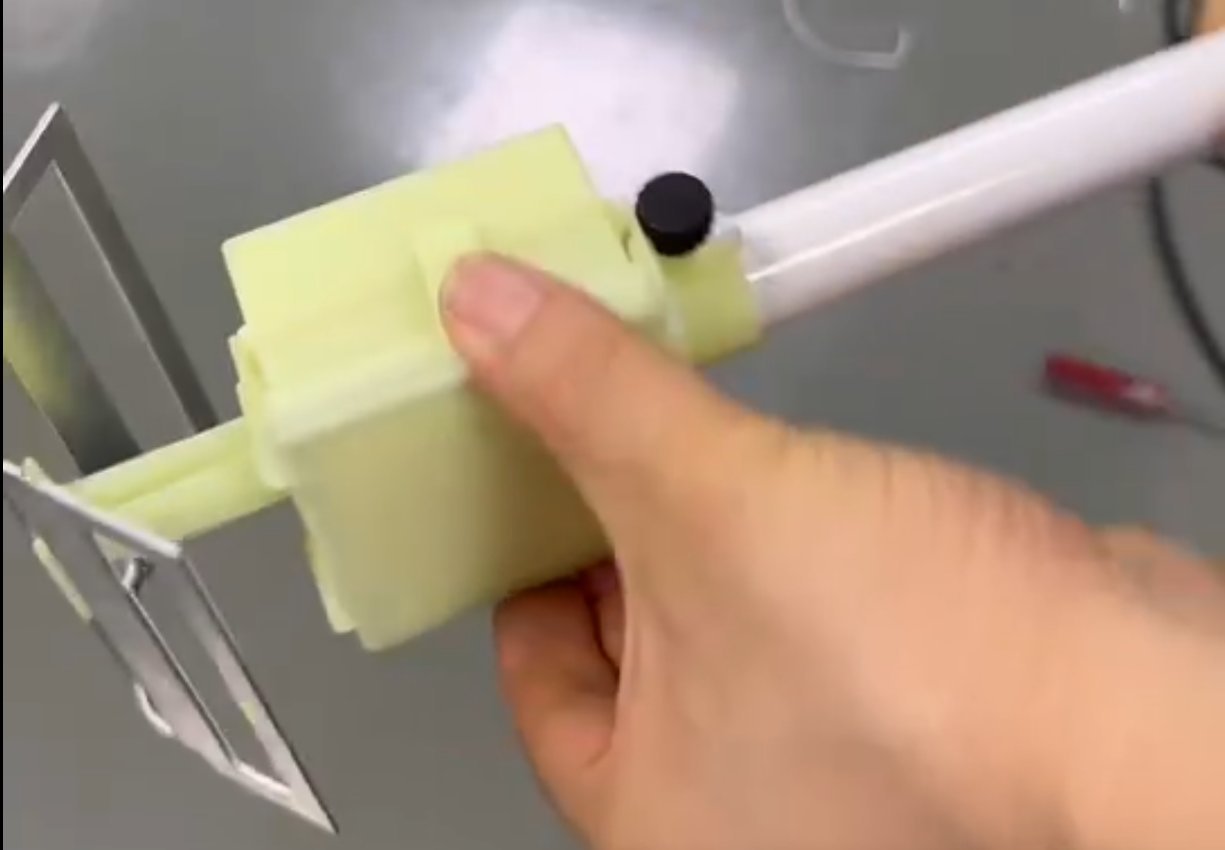
The PCB enclosure has been slightly refined and the injection molding die is currently in production and due to be completed in mid-May. While waiting for the die to be made, we’ve been testing different plastic mixes for the head enclosure to make sure that they are UV stable. The plastic mix has certain strict requirements and choosing the correct mix is crucial. It has to be RF-transparent with a low relative permittivity value, it has to endure direct sun, UV damage, and freezing weather, as well as be water-proof too.
S-Band Feed
Previously as noted in prior updates we were testing an S-band feed with the FR4 substrate. But we found that there was too much loss and the SNR values we got were not great. The move to PTFE substrate means that our experimental S-band feed is now working very well. We will be releasing this in the near future as an additional feed product that can be used with Discovery Dish. This feed will have a frequency range of 2.2 GHz - 2.3 GHz. This covers the main S-band weather satellites, other satellites like Coriolios and JASON as well as the many dump-only S-band satellites that transmit signals only over certain regions.
As requested by most people interested in an S-band feed, the S-band feed will not include a downconverter, so to use it you will either need an SDR like the HackRF which is capable of tuning to the S-band, or a third-party downconverter product.
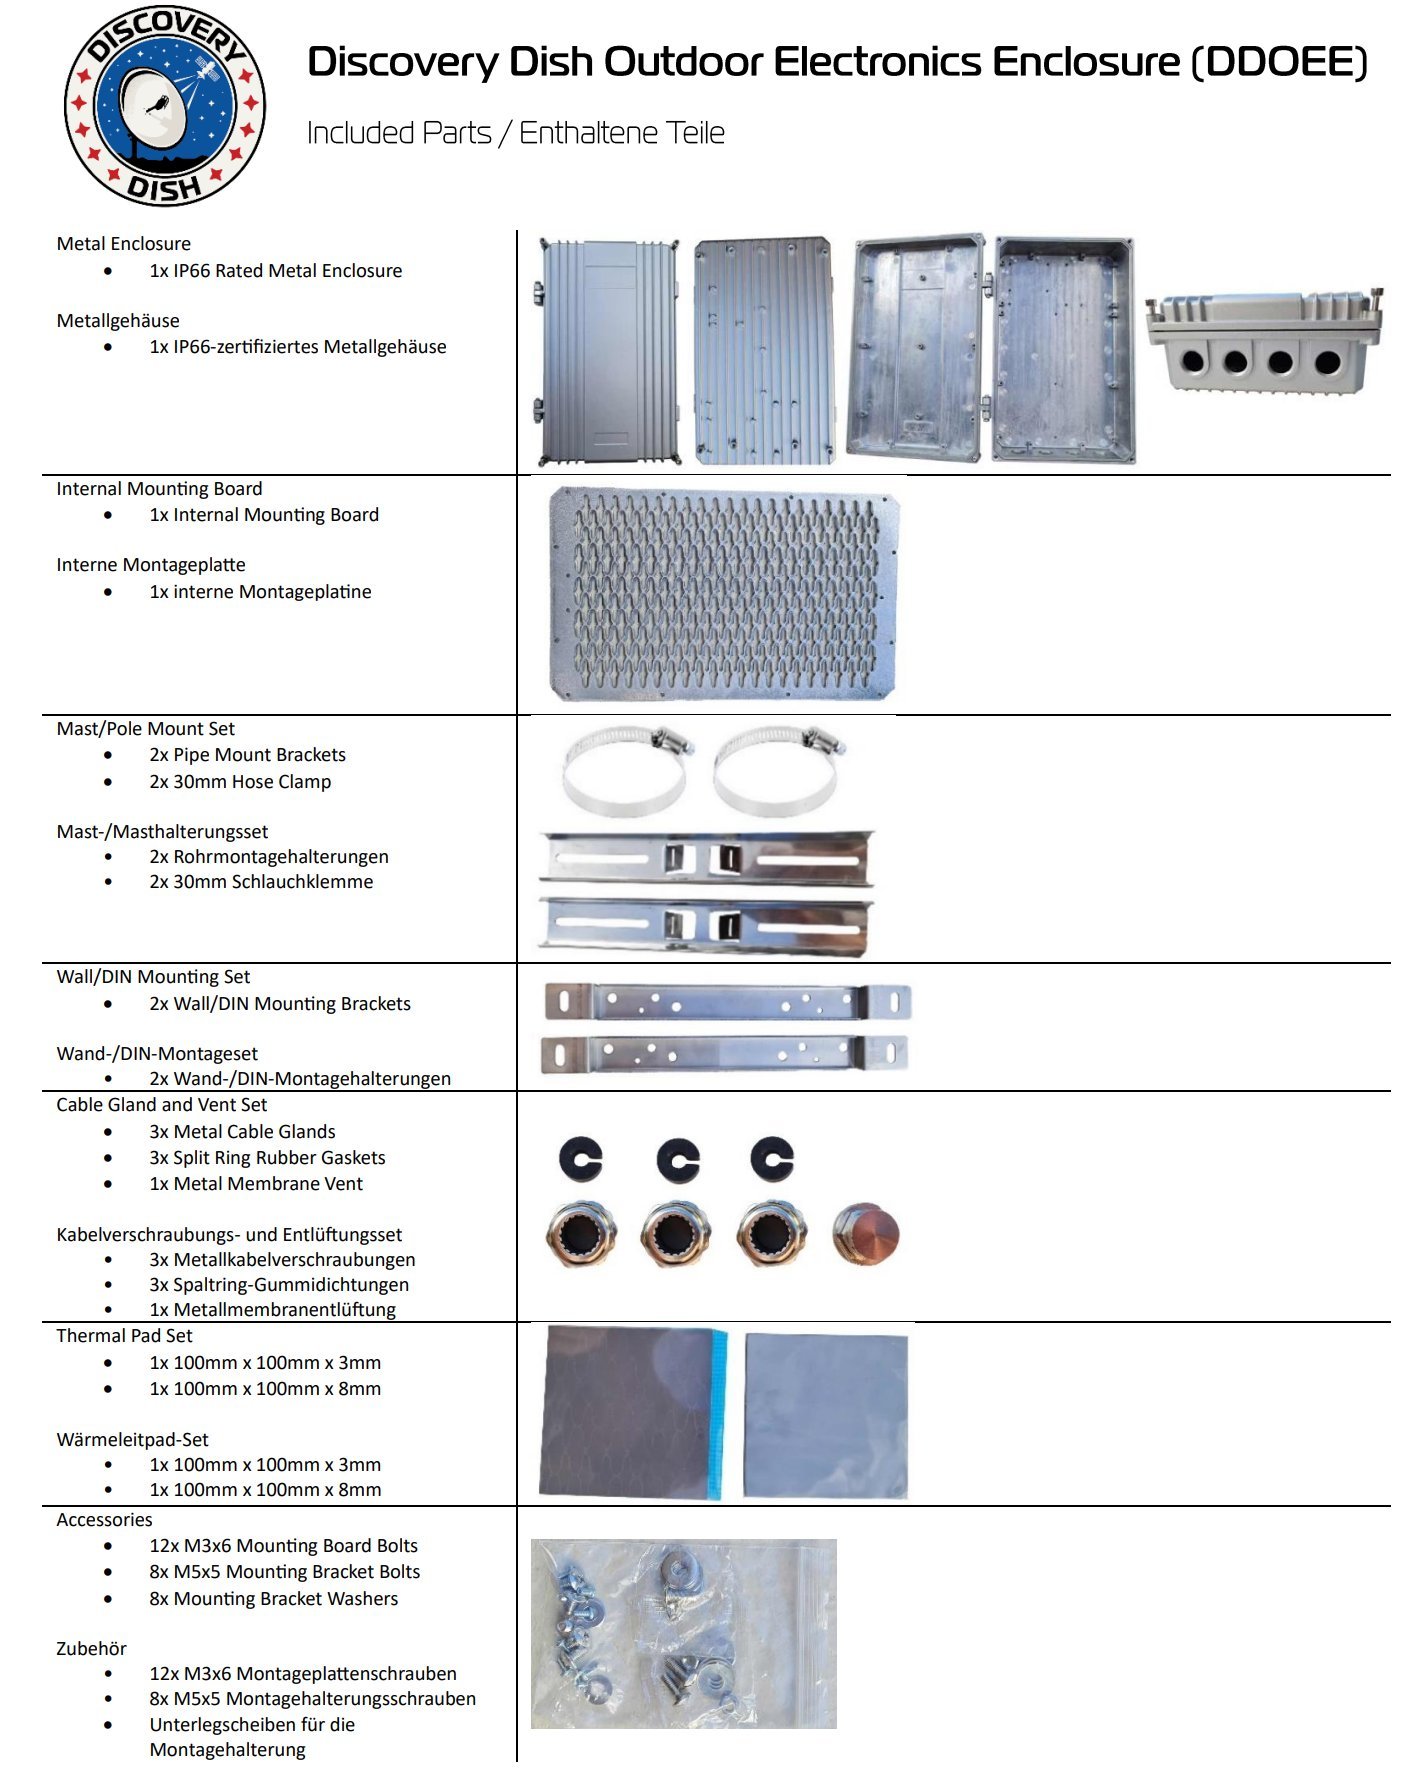
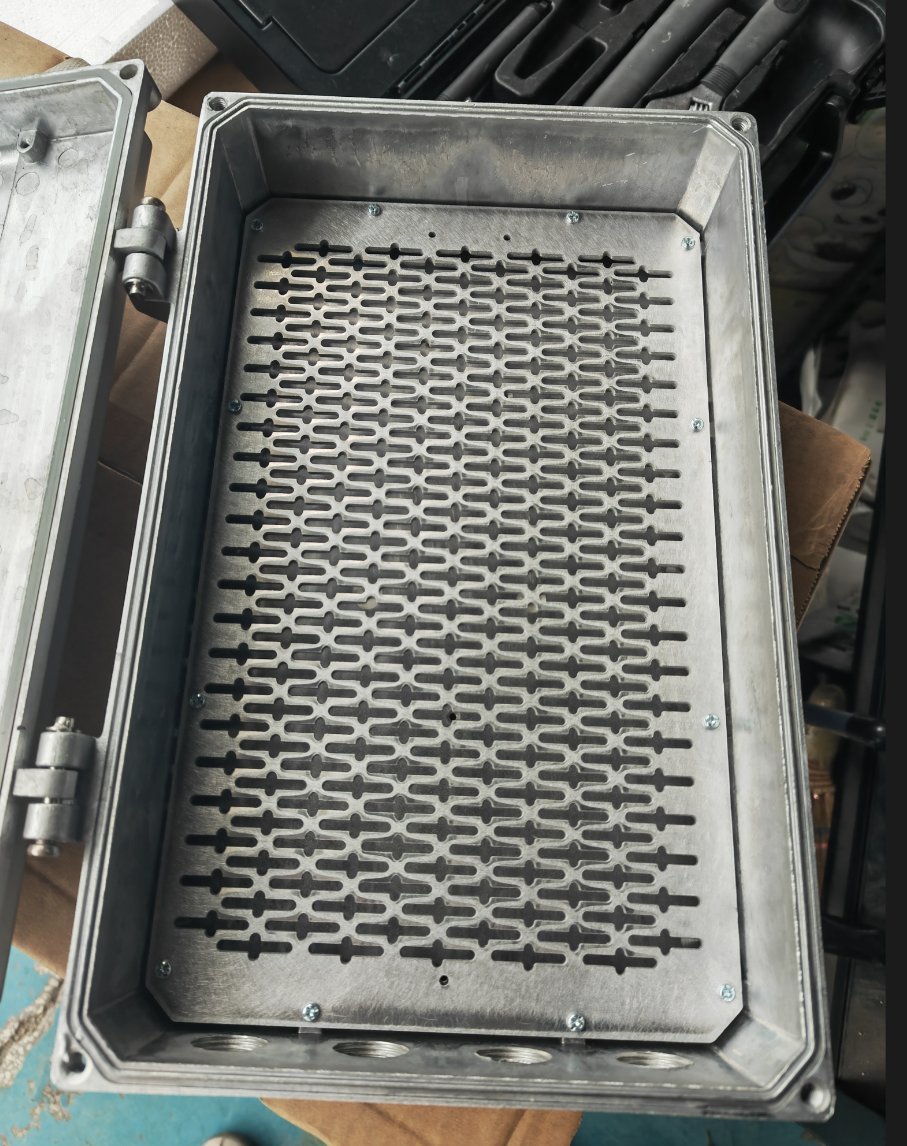
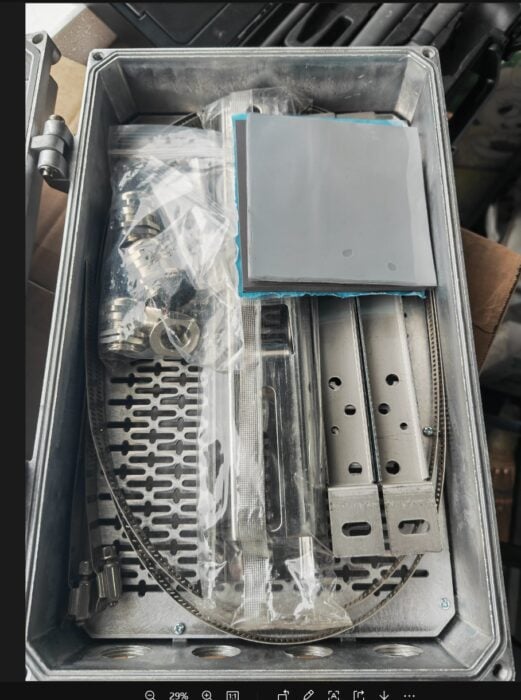
Our enclosure set is now complete, and the final packing has almost been completed. The user manual can be found here Discovery Dish Outdoor Enclosure User Manual.pdf.
The final set consists of:
- 1x Metal Enclosure
- 3x Custom metal cable glands
- 1x Vent
- 1x Electronics mounting board
- 1x Pole mounting set (with hose clamps)
- 1x Wall/DIN mounting set
- 1x 10 mm x 10 mm x 8 mm thermal pad (to be placed under the electronics mounting board)
- 1x 10 mm x 10 mm x 3 mm thermal pad (to be placed under electronics on top of the mounting board)
- 1x Set of various screws and washers
(Note that there will be some minor changes from this image in sets going out of customers - the hose clamp will be shorter, and the mounting rails will be longer)
Meteor M2-4 Launch
We mentioned in our last update that a new weather satellite Meteor M2-4 was due to launch. The launch was successful and the satellite is now in orbit. The satellite was briefly turned on after launch, and we were able to receive HRPT images from it in the L-band. However, now it is currently in a testing phase so the transmitters are often turned off. We don’t know how much longer it will be in testing, but we assume it won’t be more than a few more months.
GOES-U / GOES-19 Launch Updates
We’ve been keeping an eye on the expected launch date for the next GOES satellite. Currently, it has been delayed from April 30, 2024, to the new date of June 25, 2024, when it will be launched on a Falcon Heavy from Kennedy Space Center, Florida.
Elektro-L4 Updates
In the last update, we mentioned that we were having some problems getting SatDump to receive Elektro L4 properly on computing devices that used ARM processors. After some investigation, we determined that this was a problem with buffer size settings in SatDump and we were able to suggest a fix in https://github.com/SatDump/SatDump/pull/616 which was implemented. New versions of SatDump have this problem fixed.
Driver Tweaks
We have been looking at the RTL-SDR drivers and have found a few tweaks that can improve performance at L-band frequencies. We’ve put a modified version of the librtlsdr/librtlsdr fork up our the rtlsdrblog GitHub at https://github.com/rtlsdrblog/librtlsdr. With this fork and the PTFE feed upgrades, we now get around 5-6 dB of SNR on GOES-18.
Antenna Rotator
The low-cost antenna rotator is finishing up with prototype testing, and we are now working on improving the design’s manufacturability.
Timeline
The ramping of progress from the Chinese New Year holidays to now has been a little slower than expected, but if everything goes perfectly to plan, we will be on time for shipping by the end of June. However, this is currently a best-case scenario. There are still a few manufacturing stages to get through like the final mass production, CE testing and sea freight shipping. Unfortunately, from prior manufacturing experience, there are always setbacks along the way that slow progress, so we are conservatively pushing our advertised timeline back by about 1-2 months. We apologize for any potential delays, but we are working hard to get the product out to you ASAP!
Customer Questions
We have had a few more customer questions over email which we’d like the answer publicly below:
Would it be practical to use this kit indoors to do hydrogen-line astronomy? I ask because I live in a flat in a block of retirement flats, and wouldn’t be able to place an aerial or dish outside, but could find space for a Discovery dish + rotation gear inside.
Unfortunately, indoor Hydrogen line astronomy is out of the question. The hydrogen line signal is just too weak to be seen indoors, and there would most likely be too much interference indoors as well.
What all do i need to purchase and get for the Discovery Dish for Radio Astronomy?
You’ll need these two components from the Discovery Dish Crowd Supply store:
- Discovery Dish (Dish & Mount Only)
- Hydrogen Line Discovery Feed
You will also need a software defined radio, such as an RTL-SDR Blog V3/V4 which can be purchased separately, a computer and somewhere to mount your dish (e.g. a mast/tripod etc).
Have you tested this for C-Band / Aero downlink reception?
Currently, we do not have a C-band feed, so we have not tested it for this purpose. Generally, a larger 1.2 m+ dish is required for C-band AERO, so the 70 cm Discovery Dish may not be suitable. We may test this with Discovery Dish in the near future just in case however.
I want to purchase a hydrogen antenna. Where should I buy it? Also, please tell me what is needed to observe seti radio waves.
The Discovery Dish (Dish & Mount) and Hydrogen Line Discovery Feed can be pre-ordered from the Discovery Dish Crowd Supply store. I’m not sure exactly what you are referring to with SETI radio waves. An alien signal could in theory be on any frequency, but the 1.42 GHz Hydrogen line frequency could be a good bet as it’s a universal frequency of interest that any technological civilization would be observing. Realistically the Discovery Dish would be too small to detect potential alien signals unless they were very strong.
I’ve seen a small home made 3D-printed dish called a ‘heliocone dish’ being used for HRPT. How is Discovery Dish different?
The heliocone 3D printer design going around is a great DIY solution for L-Band polar orbiting HRPT satellites. But it has some limitations as it cannot receive the weaker geostationary satellites due to its smaller size and use of a circular polarized feed. It also cannot receive satellites using the opposite circular polarization. It also cannot receive satellites on different frequencies or the Hydrogen Line without designing a new helical feed and using a different LNA+filter combo. Discovery Dish is a more of a general purpose ‘does-it-all’ and ‘ready to use’ out-of-the-box dish. With our dish and feeds you can receive the L-Band polar orbiting HRPT satellites as well as the geostationary satellites. You can quickly swap out the feed for a different feed that covers a different band as well.