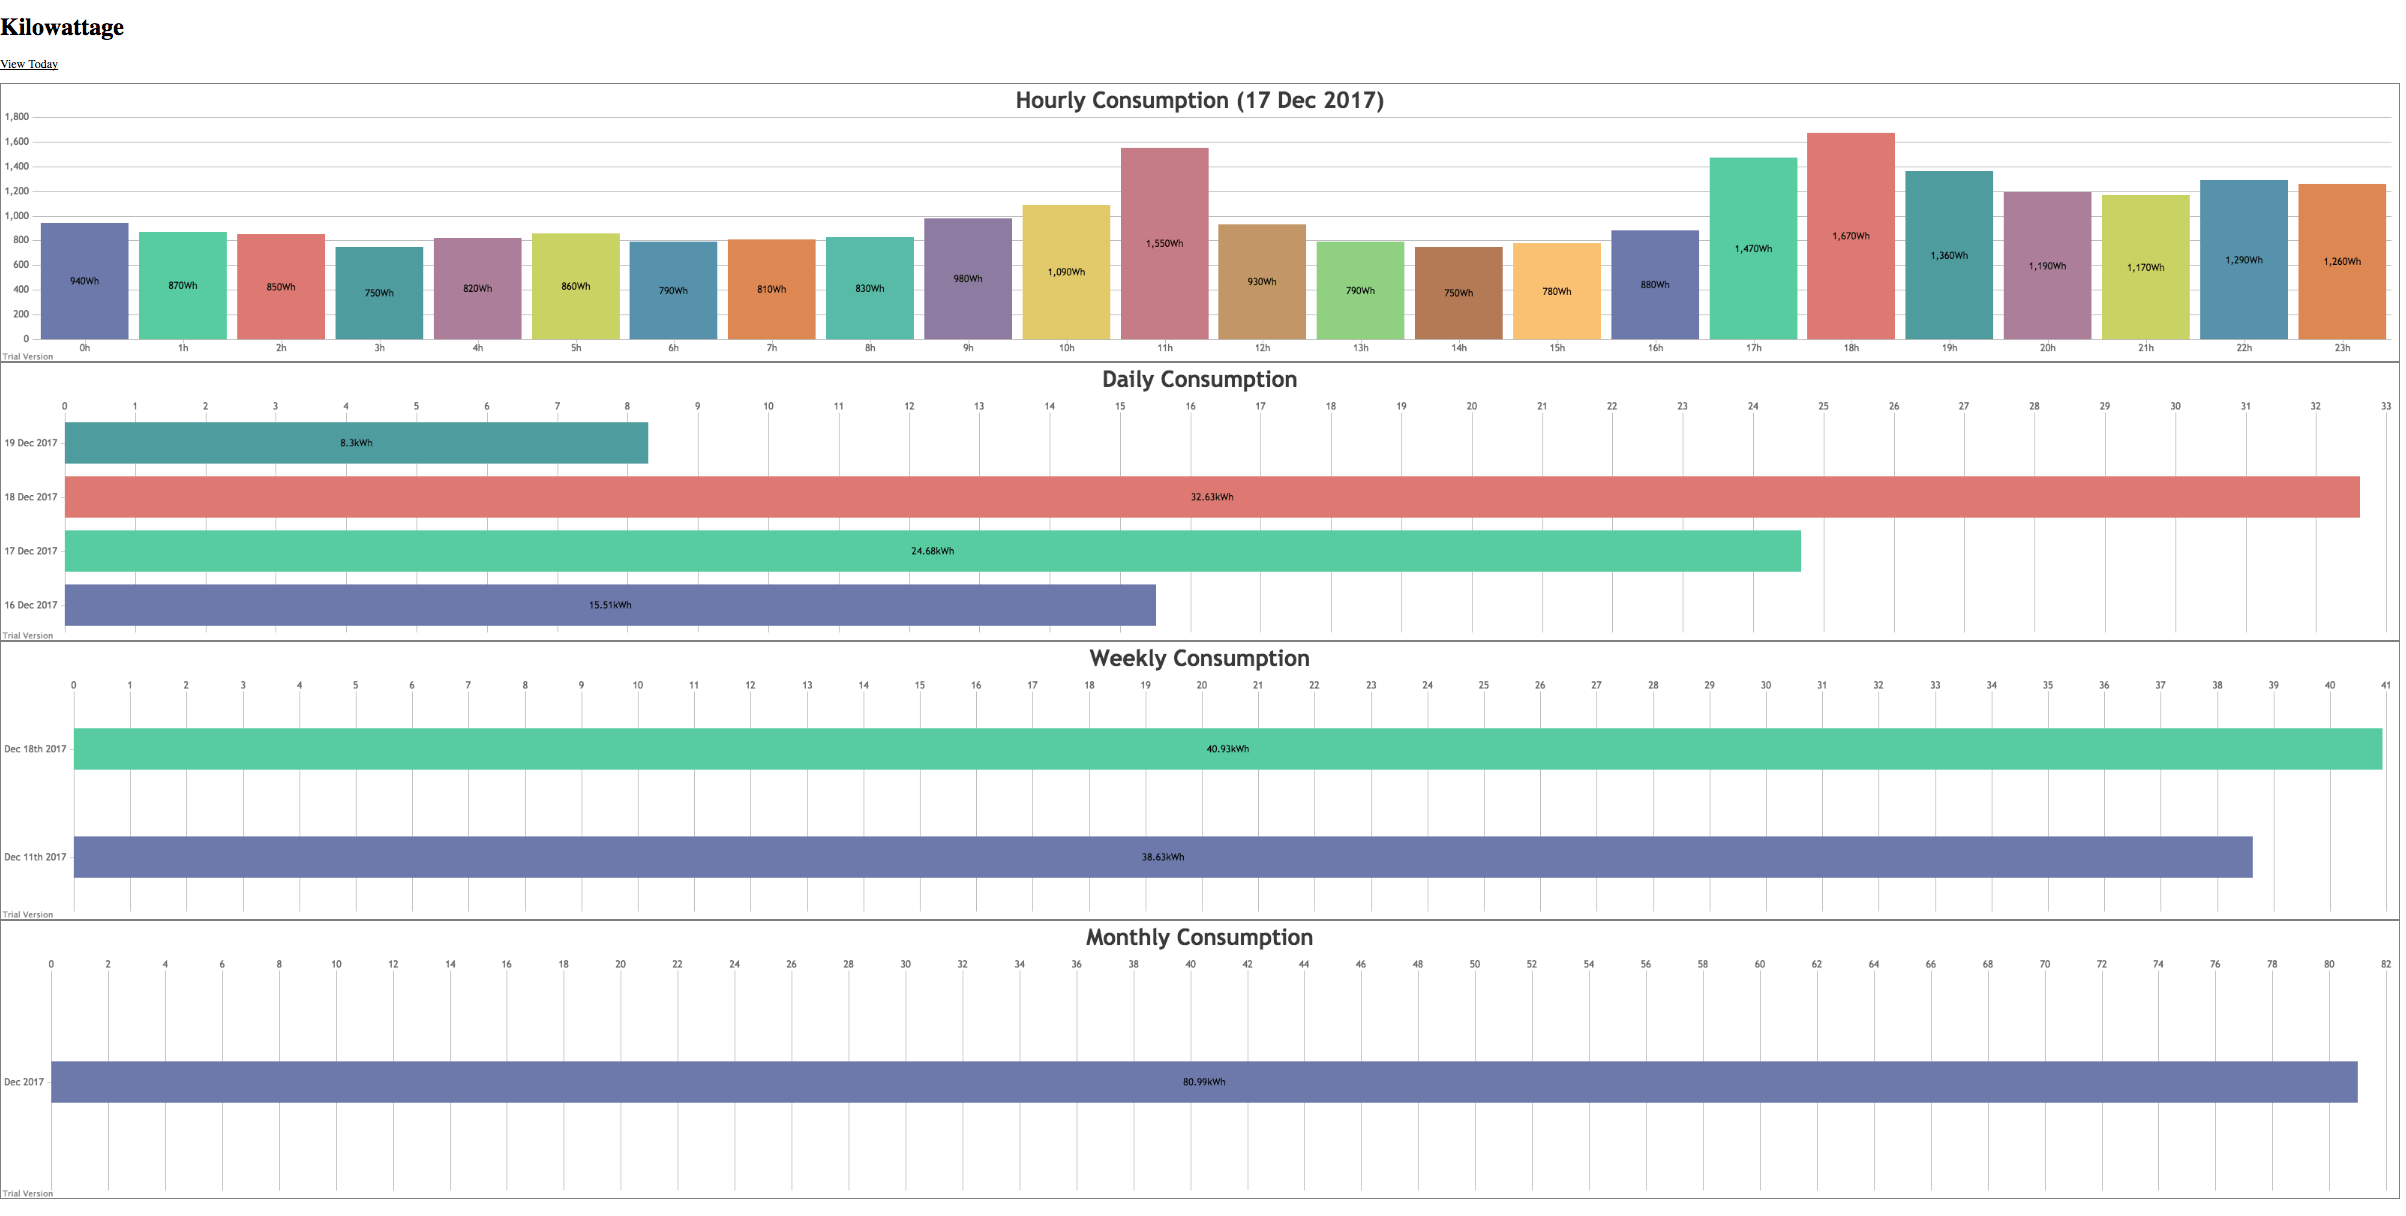
Many homes in the US and elsewhere no longer require meter reader personnel to come onto the property to read a physical meter at the back of the house. Instead the meter transmits wireless data in the 900 MHz ISM band about electricity usage, and all the meter reader has to do is turn up outside the house and take a reading from the street.
These electricity usage signals are unencrypted and can easily be decoded and displayed with an RTL-SDR and a ready to use program called rtl_amr. The signals even travel quite far, and there have been reports of receiving neighbours signals up to 600m away. K-roy took his RTL-SDR and rtl_amr and wrote on top of it a program that creates a JSON output of the data for easy processing, a PHP, SQLite3 and JQuery based database system for storing the data, and an HTML5 based page for graphing and displaying the data.
If you are in the USA, you might recognize HD Radio (aka NRSC-5) signals as the rectangular looking bars on the frequency spectrum that surround common broadcast FM radio signals. These signals only exist in the USA and they carry digital audio data which can be received by special HD Radio receivers. Earlier in the year in June a breakthrough in HD Radio decoding for SDRs like the RTL-SDR was achieved by Theori when he was able to piece together a full HD Radio software audio decoder that works in real time.
It turns out that some of these HD Radio signals run by iHeartRadio also contain other data streams such as live weather and traffic data that is consumed by HD Radio based car GPS receivers or audio head units in US vehicles. HDRadio.com also write that they can embed other data such as sports scores and emergency messages into the data stream as well.
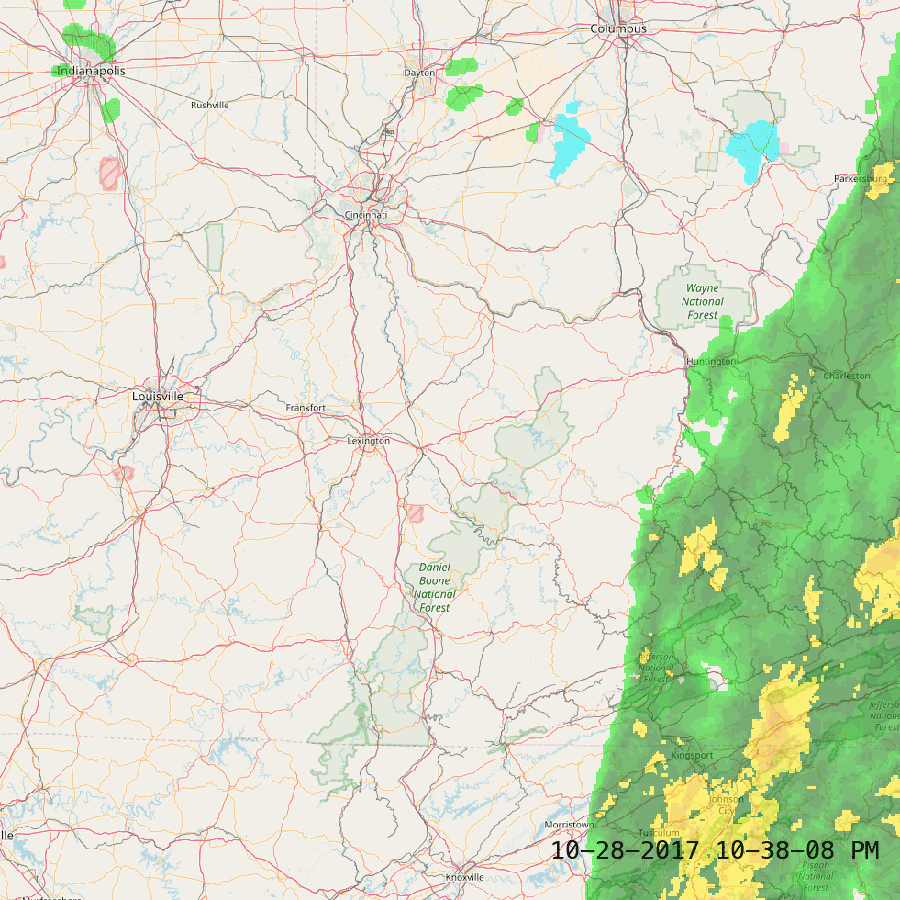
KYDronePilot's Python script utilizes Theori's decoder to save all received weather and traffic data maps for a folder. Below is an example of traffic and weather data that he received.
HD Radio Received Traffic DataHD Radio Received Weather Data
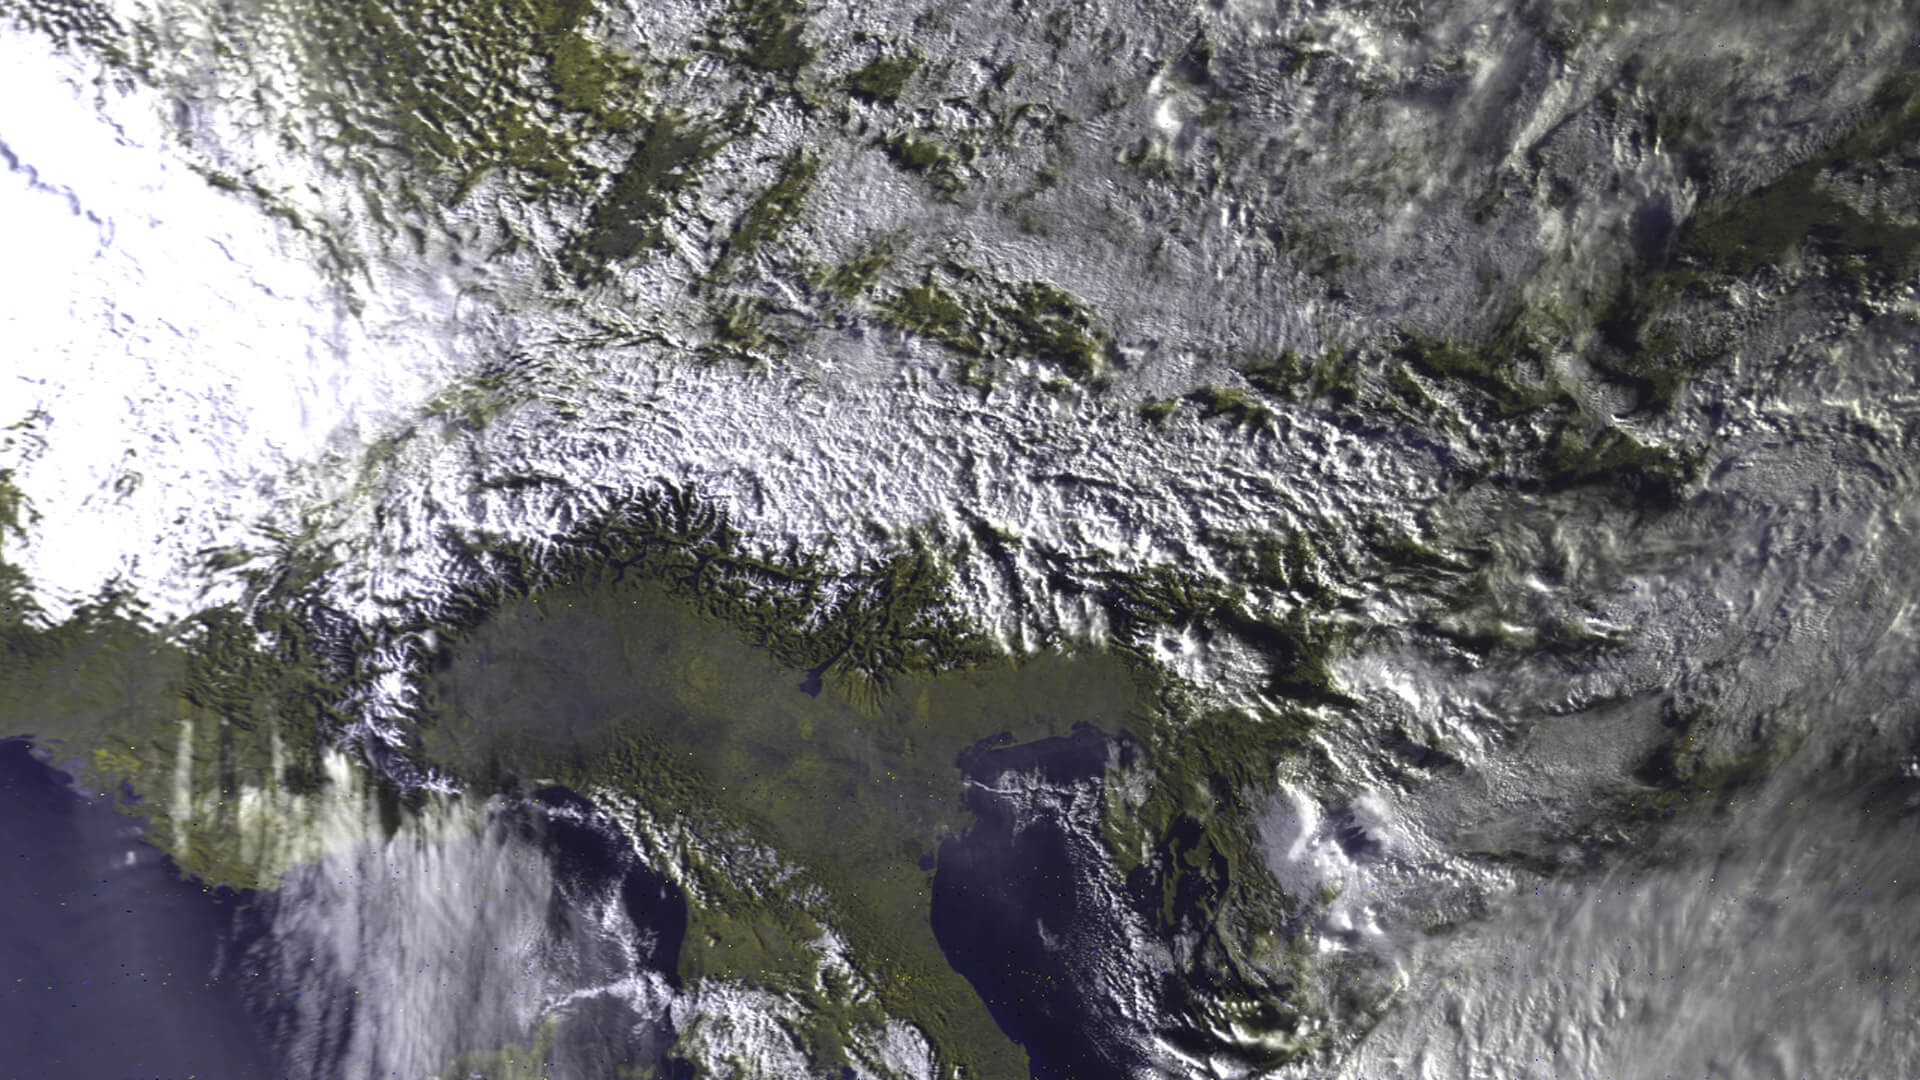
Most readers of this blog are probably familiar with the more commonly received APT images that are broadcast by the NOAA satellites at 137 MHz, or perhaps the LRPT images also broadcast at 137 MHz by the Russian Meteor M2 satellite. HRPT signals are a little different and more difficult to receive as they are broadcast in the L-band at about 1.7 GHz. Receiving them requires a dish antenna (or high gain Yagi antenna), L-band dish feed, LNA and a high bandwidth SDR such as an Airspy Mini. The result is a high resolution and uncompressed image with several more color channels compared to APT and LRPT images.
In his video Tysonpower shows how he receives the signal with his 3D printed L-band feed, a 80cm offset dish antenna (or 1.2m dish antenna), two SPF5189Z based LNAs and an Airspy Mini. As L-band signals are fairly directional Tysonpower points the dish antenna manually at the satellite as it passes over. He notes that a mechanised rotator would work a lot better though. For software he uses the commercial software available directly from USA-Satcom.com.
Over on the SDRplay forums there has been a post by a NOAA engineer showing how they are using SDRplay RSP2 units in the field for tracking their radiosonde weather balloons. A radiosonde is a small sensor package and transmitter that is carried high into the atmosphere by a weather balloon. It gathers weather data whilst transmitting the data live back down to a base stations. You can get data such as temperature, pressure, humidity, altitude and GPS location.
Bobasaurus' coworker launching a weather balloon.
The NOAA engineer on the forum (handle 'bobasaurus') wrote SkySonde, which is the software used by NOAA to decode and plot data from the radiosondes. SkySonde is freely available for public download on the NOAA website. A PDF file showing how to use the SkySonde software with an RSP2 or RTL-SDR can be found here, and the full SkySonde manual is available here. The software consists of a client and server, with the server connecting to the RSP2 or RTL-SDR, and then sending data to the client. Both server and client can run on the same PC.
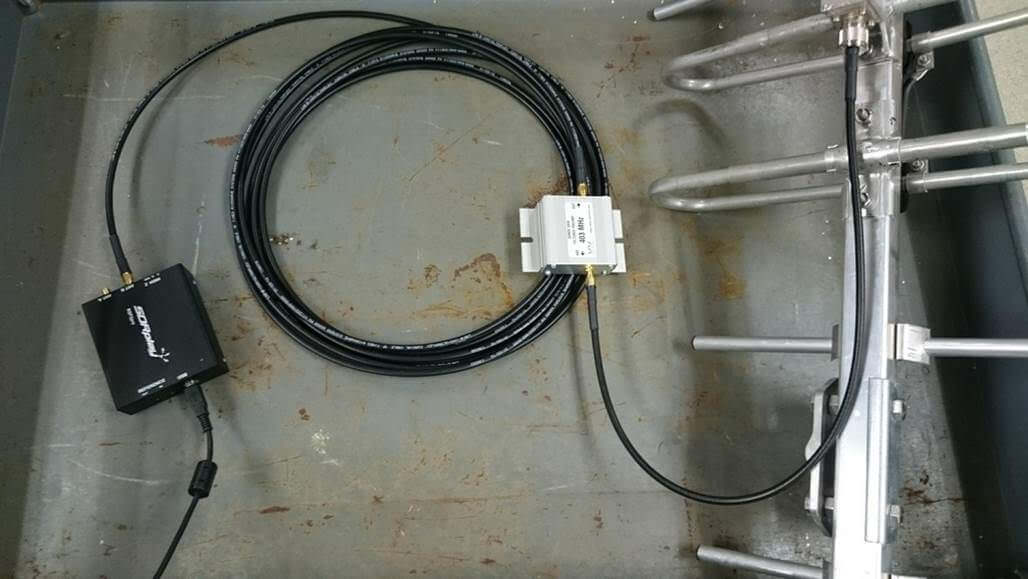
The hardware setup consists of an RSP2 (can be interchanged with an RTL-SDR), an Uputronics Radiosonde Filtered preamp and a Yagi antenna. Presumably a Yagi and LNA is not completely required, although the receivable range will be less. The RSP2 bias tee is used to power the preamp, and on a V3 RTL-SDR the bias tee should also work.
NOAA appears to use the iMet brand of radiosondes which transmit a Bell 202 signal. Bobasaurus writes that they transmit in the 401-405 MHz range. This video shows an example of such a signal. If you are in the US near an area that launches these iMet weather balloons you should be able to receive them. An alternative piece of software that supports iMet radiosondes is RS. For other radiosondes we have a tutorial that uses SondeMonitor available here.
Over on YouTube the channel "Lead Cyber Solutions" has uploaded a video presentation for the Cyber Skills Competition. In the video Christopher Flatley, James Pak and Thomas Vaccaro discuss a man-in-the-middle attack that can be performed on vehicle Tire Pressure Monitoring Systems (TPMS) with a transmit capable SDR such as a HackRF.
A TPMS system consists of small battery powered wireless sensors placed on a vehicles wheels which automatically monitor tire pressure. An LCD basestation usually exists on the dashboard of the car indicating live tire pressure. Most modern cars come with this feature, and it is simple to retrofit an older car with an aftermarket TPMS system.
The idea behind the vulnerability is that a HackRF can be used to reverse engineer the TMPS signal, and then re-transmit a new fake signal that causes the base station to read the tire pressure as low. This can set off an alarm in the car and possibly cause someone to pull over. More alarmingly, they discuss how tractors have automatic tire inflation systems which work using similar sensors. A false low pressure reading could cause the tractor tires to over inflate and be damaged.
Vulnerabilities in Vehicle TPMS (Exploit & Hacking)
In the past we have also posted about Jared Boon's work on TPMS where he shows how privacy could be breached by monitoring and tracking TPMS identifiers.
SDRAngel is a general purpose SDR program similar to other programs like SDR#, HDSDR and SDR-Console. It is compatible with Windows and Linux systems. However, SDRAngel has certain features that make it a good program to have in your SDR software arsenal.
One good feature is that if you have a TX capable SDR like a HackRF, PlutoSDR, BladeRF or LimeSDR then SDRAngel can also be used for TXing. Marty Wittrock has done a lot of previous work figuring out how to TX with LimeSDR and SDRAngel.
If you're only interested in RXing then SDRAngel also has some convenient features such as a built in DSD decoder which can be used to easily decode DMR/MOTOTRBO, dPMR, D-STAR and Yaesu System Fusion (YSF). The decoder is based on the DSDcc library which is a complete rewrite of the original open source DSD software. It is not quite as developed and feature rich as DSD+, but still does the job decently. SDRAngel also has LoRa and analogue TV (ATV) decoders built in as well, although the ATV decoder kept crashing the software for us.
SDRAngel also supports multiple VFO's on the same bandwidth, has built in decimation, a nice phosphor effect RF spectrum display and a frequency manager. There is also the ability to run multiple SDRs in the same software instance at the same time.
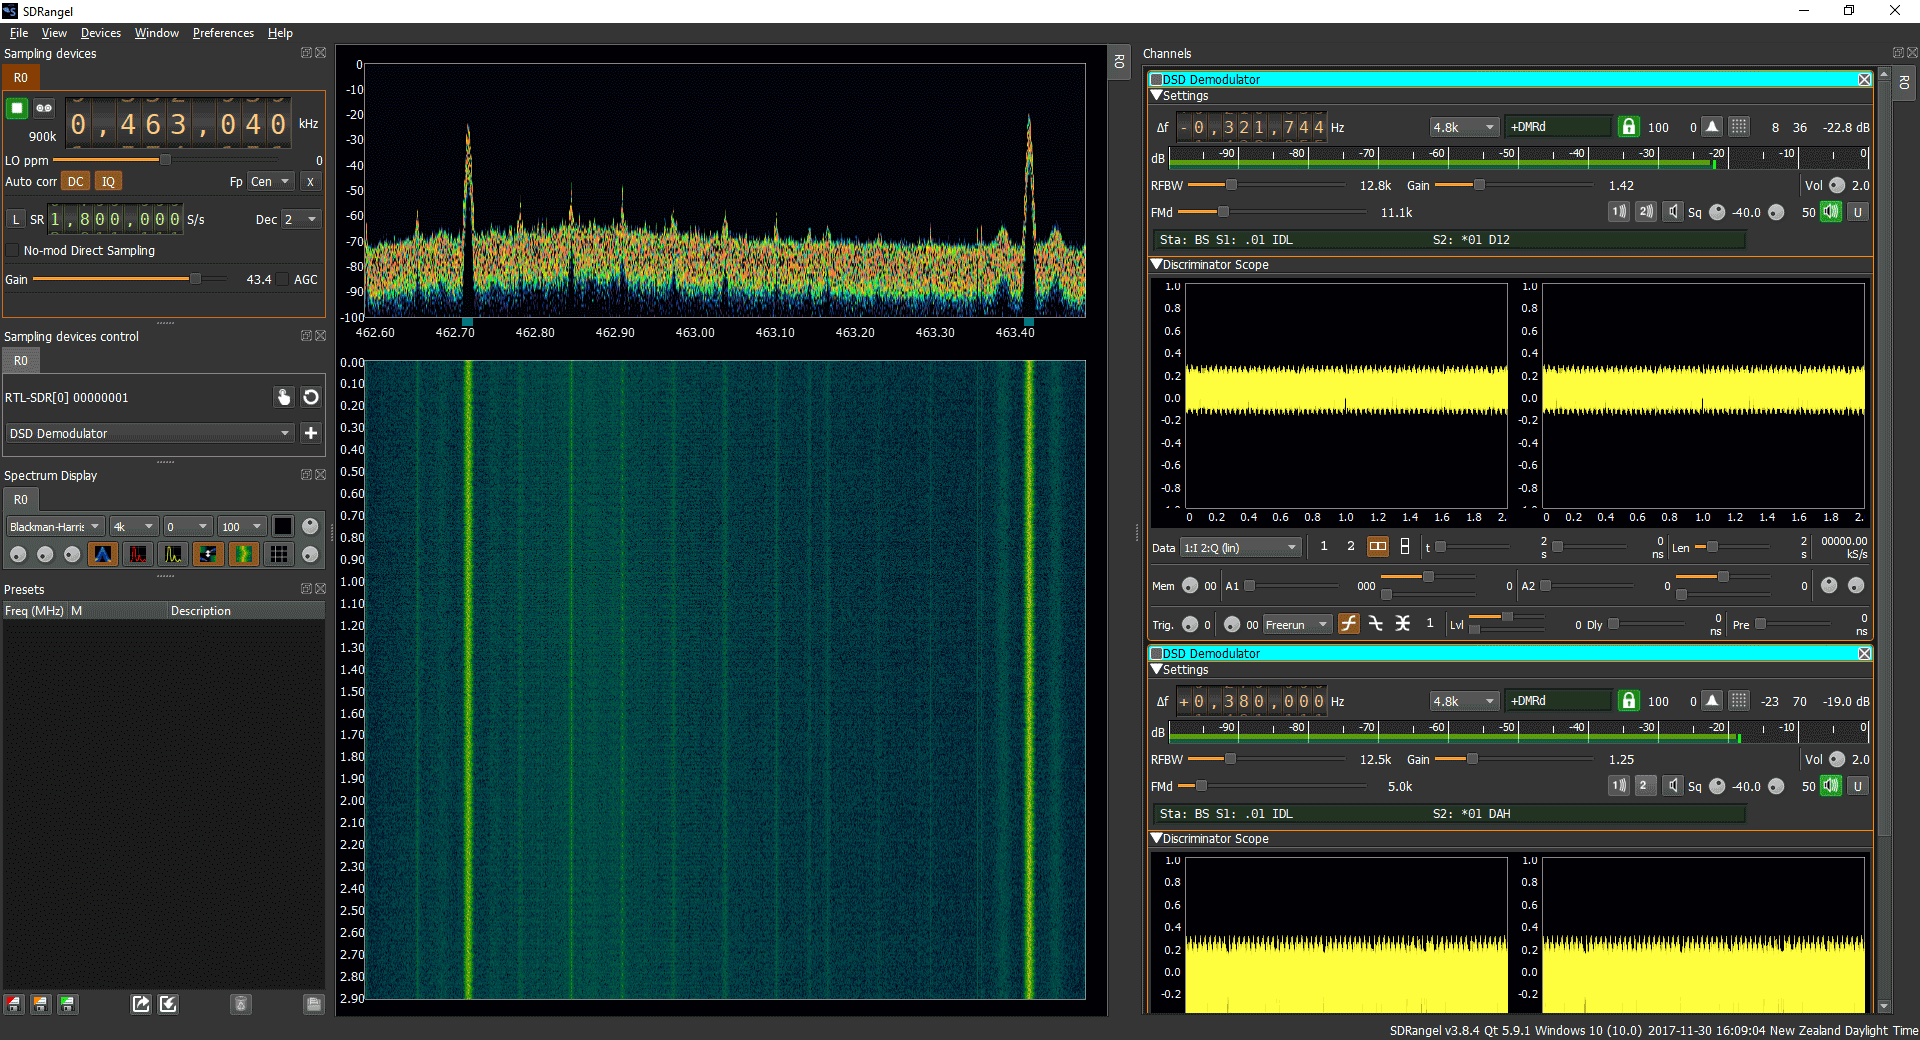
We gave SDRAngel a try on Windows and were able to easily get it up and running with an RTL-SDR. Regular WFM, FM, AM, SSB etc modes all work fine and so does the DSD decoder which we tested on a DMR signal. Getting it to decode was extremely simple, just add a DSD Demodulator channel, then click on the signal and you should be instantly decoding. It is probably the easiest way to get started on decoding a non-trunking digital voice channel, but for trunking channels and P25 signals you should probably still use Unitrunker and DSD+ or SDRTrunk.
SDRAngel Screenshot
Below is a brief tutorial on getting up an running with SDRAngel on Windows with an RTL-SDR:
Download the latest version of SDRAngel from the releases section of the GitHub. Only a build for Windows x64 is available and this has the filename sdrangel64_v3.8.4.7z (version number may change in the future). Linux .deb files are also available for various Ubuntu versions.
Using 7zip, extract the 7z file to a folder on your PC.
Plug in your RTL-SDR dongle, and run sdrangel.exe. We assume zadig has already been previously run to install the RTL-SDR drivers.
On the left under 'sampling devices control' click on the small hand icon. A drop down box will pop up, and from here you should be able to select the RTL-SDR. Press ok.
Now you can click the green play button on the top left to start the SDR.
By default the display bandwidth is zoomed in very closely with x16 decimation and a sample rate of 1 MSPS. So in the top left box change "Dec" to 1, and increase the sample rate to 2 or 2.4 MSPS if you like.
We suggest also clicking on the 'DC' button in the top left to remove the DC spike.
Now you can tune around just like in other software by using the frequency numbers in the top left.
If you want a spectrum analyzer display, go to the bottom left box, and click on the blue spectrum icon.
Unlike most other software you need to add a demodulator first before you can click on a signal and listen to it. The list of available demodulators can be found in the second box on the left, just below the hand icon which you used to add the RTL-SDR.
Select the correct demodulator for your signal of interest (e.g. WFM, NFM, AM, DSD, LoRa etc...), and then click the "+" icon. This will add the demodulator to the right of the SDRAngel window. You may want to drag the right window a little large if you cannot see all of the demodulator option as well.
Now you can click on the signal in the spectrum window to move the VFO and begin demodulating the signal. You can explore the demodulator options on the right.
Multiple demodulators can be added if desired, just repeat steps 8 - 10. If you add more than one demodulator, the VFO's will need to be dragged.
If you're having trouble getting a digital voice signal with DSD to be recognized, try zooming in with the decimation feature or reducing the sample rate. It doesn't seem to work too well with higher bandwidths.
Thanks to Mike (ghostop14) for submitting another interesting article this time about his work with spectral fusion on the WiFi and Bluetooth bands. In the article Mike describes his new Sparrow-WiFi tool, which is a tool that allows you to visualize the WiFi and Bluetooth signal spaces all in one spectral display. The hardware consists of a WiFi and Bluetooth dongle as well as optionally an SDR like the HackRF. The software displays all data simultaneously on the same display, so you can easily tell if there is some channel clashes occurring, or if there is some other source of interference. In Addition Sparrow-WiFi also works remotely and even with a Raspberry Pi mounted on a drone.
From the article he writes:
Thinking about the 2.4 and 5 GHz bands, my biggest issues with traditional wifi tools were always that apps such as inSSIDer which are great on the Windows side didn’t have a nice polished Linux GUI equivalent so I’d have to run a Windows system or virtual machine to visualize the signal space. On the flip side, some of the great Linux-only capabilities didn’t have a nice polished integrated UI and I’d have a lot of textual data, some of which the Windows tools didn’t provide, but it was harder to visualize. Then there’s the fact that wifi tools can’t “see” Bluetooth (and vice versa), and SDR historically didn’t have enough instantaneous bandwidth to show the whole 2.4 GHz or 5 GHz spectrum at one time. And, did I mention the tools don’t integrate or talk to each other so I can’t get a “single pane of glass” perspective of all the different ways to look at the same RF space simultaneously? It would be great if I could get one single view of the most common protocols and see the actual spectrum all in one place at the same time.
Now enter the era of the Internet-of-Things, new SDR receivers, and even drones and my old wifi tools seem to have been left a bit behind. Why do I say that? I can’t “see” all of the chatter from wireless networks, Bluetooth, ZigBee, NEST devices, remotes, etc. scattered all over my wireless bands in one view. Sure, I can run 3 or 4 tools independently to find the signals and try to see what they are, but it becomes tough to get a single integrated perspective. Especially when I can’t see my RF spectrum overlaid on top of the wifi SSID’s and Bluetooth advertisements to sort out what may be related to a a signal I know about and what may be something else. Ultimately, it means that I can’t clearly explain why I have poor wifi connections in one area versus another even though I may not have overlapping channels (I know, use 5 GHz and sparrow-wifi supports that too). The reason for this is simple; current tools don’t have true spectral awareness based on the most common possibilities in one integrated solution.
Now, let’s ask even harder questions. What if I want to step up my wifi “wardriving” and start “warflying”? Or, what if I need a mobile platform that can be sent into an area on a rover? Can I bring the same spectral awareness in a small enough platform to fly for example as an under-350-gram payload complete with power, wifi, spectral scans, and even pull GPS for anything we see? And, can I interact with it remotely for real-time visibility or have it work autonomously? Okay, now you’re just asking a lot. These were all goals of a new tool I just released called “Sparrow-wifi” which is now available on GitHub (https://github.com/ghostop14/sparrow-wifi.git). Sparrow-wifi has been purpose-built from the ground up to be the next generation 2.4 GHz and 5 GHz spectral awareness and visualization tool. At its most basic, it provides a more comprehensive GUI-based replacement for tools like inSSIDer and linssid and runs specifically on Linux. In its most comprehensive use cases, Sparrow-wifi integrates wifi, software- defined radio (HackRF), advanced Bluetooth tools (traditional and Ubertooth), GPS via gpsd, and drone/rover operations using a lightweight remote agent and GPS using the Mavlink protocol in one solution.
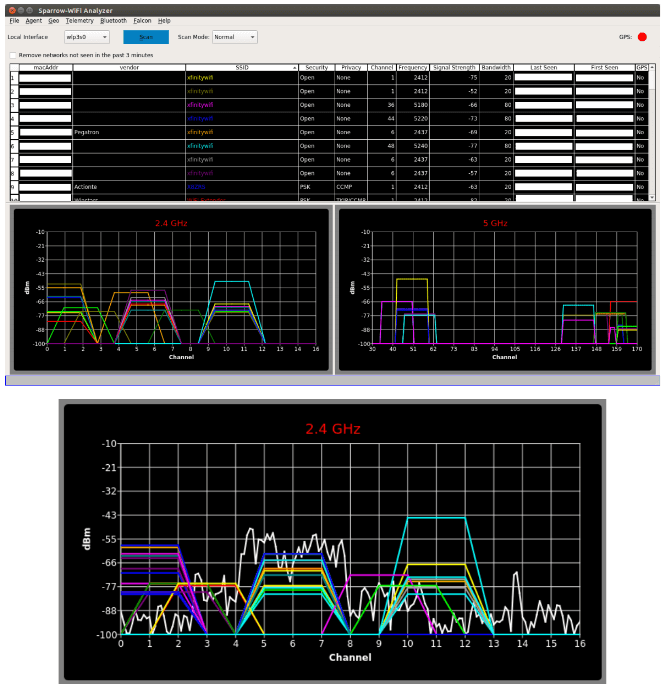
Sparrow-Wifi Spectral Fusion. Wifi & Bluetooth dongle data + Live spectrum from a HackRF.
A full list of the possible scenarios that Sparrow-WiFi was designed for is pasted bleow.
Basic wifi SSID identification.
Wifi source hunt - Switch from normal to hunt mode to get multiple samples per second and use the telemetry windows to track a wifi source.
2.4 GHz and 5 GHz spectrum view - Overlay spectrums from Ubertooth (2.4 GHz) or HackRF (2.4 GHz and 5 GHz) in real time on top of the wifi spectrum (invaluable in poor connectivity troubleshooting when overlapping wifi doesn't seem to be the cause).
Bluetooth identification - LE advertisement listening with standard Bluetooth, full promiscuous mode in LE and classic Bluetooth with Ubertooth.
Bluetooth source hunt - Track LE advertisement sources or iBeacons with the telemetry window.
iBeacon advertisement - Advertise your own iBeacons.
Remote operations - An agent is included that provides all of the GUI functionality via a remote agent the GUI can talk to.
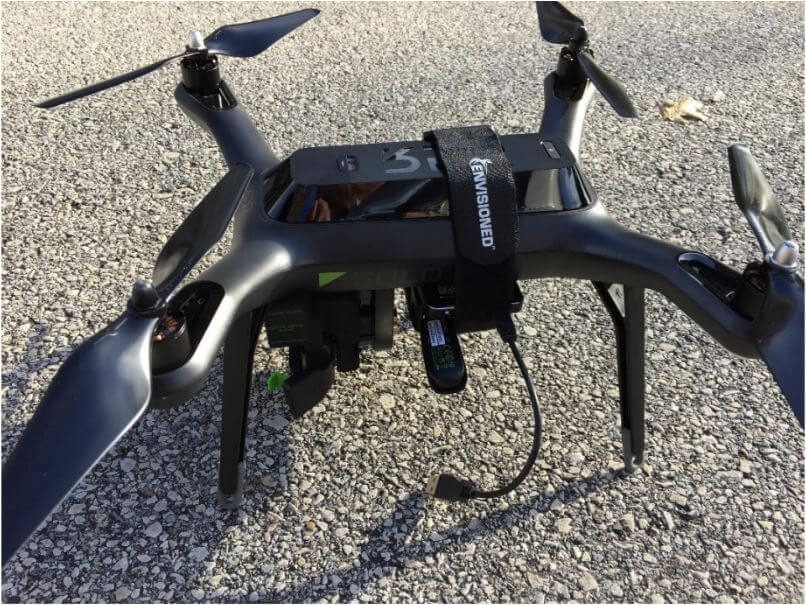
Drone/Rover operations - The agent can be run on systems such as a Raspberry Pi and flown on a drone (it’s made several flights on a Solo 3DR), or attached to a rover in either GUI-controlled or autonomous scan/record modes. And yes, the spectrum output works over this connection as well.
The remote agent is HTTP JSON-based so it can be integrated with other applications
Import/Export - Ability to import and export to/from CSV and JSON for easy integration and revisualization. You can also just run 'iw dev <interface> scan' and save it to a file and import that as well.
Produce Google maps when GPS coordinates are available for both discovered SSID's / Bluetooth devices or to plot the wifi telemetry over time.
In his area of Barajas, Spain the meteorological agency recently switched to the newer RS41-SGP radiosondes. To decode these Daniel uses the open source "RS" software which is capable of decoding various radiosondes including RS41. He notes that for now it is better to use his fork of "RS" as the base version contains a bug. He also shows how the received data can be plotted in Viking, which is a program used for plotting things like GPS tracks on a map.
Finally he shows how to feed the radiosonde data to the APRS-IS network. APRS is a packet radio system used by hams which works via radio and the internet, allowing for worldwide communication by radio. Feeding the data into APRS-IS allows anyone to see the flightpath on a site like aprs.fi.
RS41 Radiosonde Flight Path recorded by Daniel Estevez

![[EN subs] HRPT - Erste Bilder! und mein Setup](https://www.rtl-sdr.com/wp-content/plugins/wp-youtube-lyte/lyteCache.php?origThumbUrl=https%3A%2F%2Fi.ytimg.com%2Fvi%2FxuqsLo48eWg%2F0.jpg)