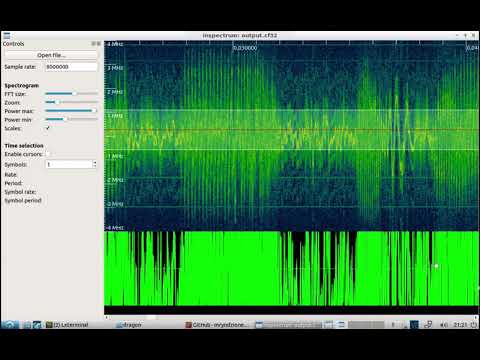
Look4Sat: An Android App for Tracking and Predicting Amateur Radio and Weather Satellite Passes

Thank you to Arty Bishop for submitting news about his recently released Android App called Look4Sat. Look4Sat is a satellite tracker and pass predictor with a focus on amateur radio and weather satellites. The app is free, ad free, and open source on GitHub.  Arty writes that he's programmed this as a learning exercise and notes:

I always wanted to have an offline and not bloated satellite tracker on my phone, as carrying the laptop at all times is kinda not too handy.

The app uses predict4java library under the hood and is written in Kotlin. The TLE files are from Celestrak and the transmitters info is from SatNOGS and once they are  ownloaded the app doesn't need an internet connection.

The app creation and design is hugely inspired by Gpredict which is an absolutely brilliant piece of software. Thank you, Alexandru!

Obviously there is no ads and it's totally free. Hope more people find Look4Sat useful.

The features include:

  • Calculating satellite passes for up to one week (168 hours)
  • Calculating passes for the current or manually entered location
  • Showing the list of currently active and upcoming satellite passes
  • Showing the active pass progress, polar trajectory and transceivers info
  • Showing the satellite positional data, footprint and ground track on a map
  • Offline first: pass prediction is done offline. It's up to you to decide when
    to update the TLE file and the transceivers DB. (Updates once a week are recommended)
Look4Sat Android App Screenshots

Using Windows Subsystem For Linux (WSL) to Run Linux SDR Programs on Windows 10

Thank you to Happysat who has shared with us a useful tutorial that explains how we can run Linux only SDR programs on a Windows 10 system using the Windows Subsystem For Linux (WSL) feature. WSL is a feature available on Windows 10 which is a Linux compatibility layer designed for running Linux binaries natively on Windows 10. This means that no Virtual Machine with shared resources is required, instead the full resources of your system are available. 

Happysat writes:

Many people using Windows 10 now since Windows 7 is EOL, and WSL is part of the system kinda "free" so why not use it :)

Together with a X-Server and and Desktop like XFCE4, it can be great for running SDR applications in Linux thru rtl_tcp.

Very fast startup in seconds and not much packet loss thru tcp, quite alot linux sdr applications are working very good.

No allocating resources like a VM.

Sometimes better then Ubuntu on a VM.

Software tested: AX-25 Packet Radio, Dab Radio, DSD, Es-Hail Beacon Tracker, Sat Tracking with Gpredict and Gqrx, NOAA Reception WxToImg, Radiosonde Decoding, Shortwave Reception and some more tips and tricks about WSl and SDR.

The steps appear to be fairly simple. Just enable WSL in the Windows 10 Features panel, download a Linux distro built for WSL and run the .exe file. Then you'll have access to a Linux terminal where you can install a GUI desktop environment, the RTL-SDR drivers, and other Linux SDR programs. Happysats tutorial shows how to install and use various Linux programs via WSL.

It seems that the RTL-SDR cannot be directly accessed via the USB in WSL, however, by the workaround is to simply run rtl_tcp in your Windows environment, and connect to the local IP in the Linux environment. This means that only programs that accept rtl_tcp as an input, or demodulated audio from a program like GQRX can be used.

GQRX Running on Windows 10 via WSL

New Elad FDM-S3 Specifications and Photos

The Elad FDM-S3 is an upcoming high performance Hf speciality SDR that is expected to be released this year with a price of 949.90 € ($1040 USD). Over on the swling.com blog, and the Elad website we've seen some recently released information about the new specs.

--- WIDEBAND DIRECT SAMPLING RECEIVER ----

 JAN 2020 SPECIFICATIONS

  • 2 switchable HF Antenna inputs direct sampling
  • 1 VHF Antenna input direct sampling
  • Works with FDM-SW2 ELAD Software & SDR Console
  • Optional: Antenna RF input  downconversion (50MHz - 2GHz preview)
  • Real Time I/Q Stream Bandwidth 192khz, 384KHz, 1536KHz, 12880KHz, 24576KHz
  • 122.88 MSPS - 98.304 MSPS 16bit A/D converter
  • Clock synchronized to GNSS Global Navigation Satellite System or 10MHz Ext Ref
  • GNSS works with GPS, GLONASS, GALILEO, BEIDOU
  • Auxiliary USB used to monitor GPS status or for clock firmware updates
  • 10MHz Clock reference Output
  • 10MHz internal standart TCXO 100ppb referenced, optional 3ppb OCXO referenced

Compared to the FDM-S2 the FDM-S3 looks to have significantly increased bandwidth, meaning now that almost the entire HF spectrum could be monitored. ALso the optional built in downconverter would allow tuning up to 2 GHz, where it was previously limited to only 160 MHz on the FDM-S2. The new GNSS referenced clock and improved TCXO/OCXO is also going to mean significantly improved frequency stability.

The Elad FDM-S3
The Elad FDM-S3

An Overview of the Elektor SDR Hands-on Arduino Shield Kit

Over on YouTube, Elektor have uploaded an overview of their Elektor SDR Hands-on kit. The €49.46 kit is an Arduino shield, that turns an Arduino microcontroller board into a 150 kHz to 30 MHz capable SDR receiver. It is based on the G8JCFSDR, which is an RF front end downconverter that allows a PC soundcard to be used as an SDR analog to digital converter.

To compliment the SDR is a book that goes over introductory topics such as shortwave reception, explains signal to noise ratio and interference, different types of antennas, software, digital modes, SDR measurements, receiving and finally WSPR and QRP transmissions. Overall this looks like a good kit for learning about the technical basics of SDRs.

An Overview of the Elektor SDR Hands-on Kit

Using HackRFs to Locate a UAV Transmitter via Signal Strength Analysis

During the 2019 IEEE International Symposium on Broadband Multimedia Systems and Broadcasting conference, authors Xuemei Huang, Kun Yan, Hsiao-Chun Wu and Yiyan Wu presented a research paper titled "Unmanned Aerial Vehicle Hub Detection Using Software-Defined Radio". In their work they describe how they were able to use three HackRFs to determine the location of a UAV drone transmitter. The method they use is fairly simple as it makes use of path loss propagation models to determine an estimated distance from each HackRF, so prior knowledge of the transmitter properties is still required.

The applications of unmanned aerial vehicles (UAVs) have increased dramatically in the past decade. Meanwhile, close-range UAV detection has been intriguing by many researchers for its great importance in privacy, security, and safety control. Positioning of the UAV controller (hub) is quite challenging but still difficult. In order to combat this emerging problem for public interest, we propose to utilize a software-defined radio (SDR) platform, namely HackRF One, to enable the UAV hub detection and localization. The SDR receiver can acquire the UAV source signals. The theoretical path-loss propagation model is adopted to predict the signal strength attenuation. Thus, the UAV hub location can be estimated using the modified multilateration approach by only three or more SDR receivers.

Unmanned Aerial Vehicle Hub Detection Using Software-Defined Radio

A Neat HF SDR Receiver made from an Audio Reverb Chip

Over on his blog, Ray Ring has posted about his neat little "Mini SDRadio" made from an Si5351 clock generator and a FV-1 reverb audio processor chip.

The Spin Semiconductor FV-1 is a digital reverb chip designed for creating custom audio effects in products. As it is a digital chip it makes use of an ADC and DAC, with the audio effects DSP placed in the middle of the chain. However, by using custom code Ray was able to convert the ADC into an SDR by creating custom AM/FM and LSB demodulators on the programmable DSP instead of the audio effects.

His post contains the full schematics, code and PCB files required to recreate his work if desired.

[Also covered on Hackaday]

Demo of mini SDR receiving VOLMET Station

Shazam Style Automatic Signal Identification via the Sigidwiki Database

Thank you to José Carlos Rueda for submitting news about his work on converting a "Shazam"-like Python program made originally for song identification into a program that can be used to automatically identify radio signals based on their demodulated audio sounds. Shazam is a popular app for smartphones that can pull up the name of any song playing within seconds via the microphone. It works by using audio fingerprinting algorithms and a database of stored song fingerprints.

Using similar algorithm to Shazam, programmer Joseph Balikuddembe created an open source program called "audio_recogition_system" [sic] which was designed for creating your own audio fingerprint databases out of any mp3 files.

José then had the clever idea to take the database of signal sounds from sigidwiki.com, and create an identification database of signal sounds for audio_recogition_system. He writes that from his database the program can now identify up to 350 known signals from the sigidwiki database. His page contains the installation instructions and a link to download his premade database. The software can identify via audio that is input from the PC microphone/virtual audio cable or from a file.

Fingerprinted Audio Samples of Radio Signals

Cheap and Easy Hydrogen Line Radio Astronomy with an RTL-SDR, WiFi Parabolic Grid Dish, LNA and SDRSharp

We've recently been testing methods to help budding amateur radio astronomers get into the hobby cheaply and easily. We have found that a low cost 2.4 GHz 100 cm x 60 cm parabolic WiFi grid antenna, combined with an RTL-SDR and LNA is sufficient to detect the hydrogen line peak and doppler shifts of the galactic plane. This means that you can create backyard hydrogen line radio telescope for less than US$200, with no complicated construction required.

If you don't know what the hydrogen line is, we'll explain it here. Hydrogen atoms randomly emit photons at a wavelength of 21cm (1420.4058 MHz). Normally a single hydrogen atom will only very rarely emit a photon, but the galaxy and even empty space is filled with many hydrogen atoms, so the average effect is an observable RF power spike at ~1420.4058 MHz. By pointing a radio telescope at the night sky and averaging the RF power over time, a power spike indicating the hydrogen line can be observed in a frequency spectrum plot. This can be used for some interesting experiments, for example you could measure the size and shape of our galaxy. Thicker areas of the galaxy will have more hydrogen and thus a larger spike, whereas the spike will be significantly smaller when pointing at empty space. You can also measure the rotational speed of our galaxy by noting the frequency doppler shift.

The 2.4 GHz parabolic WiFi grid dishes can be found for a cheap at US$49.99 on eBay and for around US$75 on Amazon. Outside of the USA they are typically carried by local wireless communications stores or the local eBay/Amazon equivalent. If you're buying one, be sure to get the 2.4 GHz version and NOT the 5 GHz version. If you can find 1.9 GHz parabolic grid dish, then this is also a good choice. Although we haven't tested it, this larger 2.4 GHz grid dish would probably also work and give slightly better results. WiFi grid antennas have been commonly used for GOES and GK-2A geosynchronous weather satellite reception at 2.4 GHz with RTL-SDRs as well and we have a tutorial on that available on our previous post.

[2025 Update: With post-COVID inflation, the prices of these dishes are quite a bit higher now. You might also want to consider our new Discovery Dish product, which is a dish + 1.42 GHz feed + filter + LNA all in one.]

These dishes are linearly polarized but that is okay as hydrogen line emissions are randomly polarized. Ideally we would have a dual polarization (NOT circular polarized) feed, but linear appears to be enough and is much simpler. In addition, the 2.4 GHz feed is obviously not designed for 1420 MHz, but just like with GOES at 1.7 GHz the SWR is low enough that it still works.

The animation below shows a hydrogen line "drift" scan performed with the 2.4 GHz WiFi dish, an RTL-SDR Blog V3 and a NooElec SAWBird H1 LNA. The scan is performed over one day, and we simply let the rotation of the earth allow the Milky Way to drift over the antenna. The Stellarium software on the left shows the movement of the Milky Way/galactic plane over the course of a day for our location. The dish antenna points straight up into the sky, and we have set Stellarium to look straight up too, so Stellarium sees exactly what our dish antenna is seeing.


You can clearly see that there is a lump in the radio spectrum at around 1420.40 MHz that grows when parts of the Milky Way pass over the antenna. This lump is the hydrogen line being detected. As our Milky Way galaxy is filled with significantly more hydrogen than empty space, we see a larger lump when the antenna points at the Milky Way, and only a very small lump when it points away.

It's important to ignore the very narrowband spikes in the spectrum. These narrowband spikes are simply radio interference from electronics from neighbors - probably TVs or monitors as we note that most of the interference occurs during the day. There is also a large constant spike which appears to be an artifact of the LNA. The LNA we used has a 1420 MHz filter built in, but LCD TVs and other electronics in today's suburban environment spew noise all across the spectrum, even at 1420 MHz.

You can also note that the hydrogen line peak is moving around in frequency as different parts of the galaxy pass overhead. This indicates the doppler shift of the part of the galaxy being observed. Because the arms of the galaxy and the hydrogen in it is rotating at significant speeds, the frequency is doppler shifted relative to us.

Using the power and doppler shift data of the hydrogen line is how astronomers first determined the properties of our galaxy like shape, size and rotational speed. If we continued to scan the sky over a few months, we could eventually build up a full map of our galaxy, like what CCERA have done as explained in this previous post.

Continue reading