Tagged: hydrogen line

YouTube Video Replicates our Galactic Hydrogen Line Detection Tutorial

Earlier in the year we posted a tutorial showing how to detect the Galactic Hydrogen Line at home with less than $200 in components. All that is really needed is a 2.4 GHz WiFi dish, an RTL-SDR and an LNA. With this setup it's possible to do home science like determining the size, shape and rotational speed of our own galaxy. 

Over on YouTube user Nicks Tech Hobby has successfully replicated our tutorial with similar hardware, and has uploaded a time lapse video showing his results. His success confirms that this is a good way to get introduced into radio astronomy. What's also interesting is that it is possible to spot the Hydrogen line energy on the live waterfall even without averaging/integration. 

My first successful attempt to detect galactic hydrogen (Hydrogen line)

Cheap and Easy Hydrogen Line Radio Astronomy with an RTL-SDR, WiFi Parabolic Grid Dish, LNA and SDRSharp

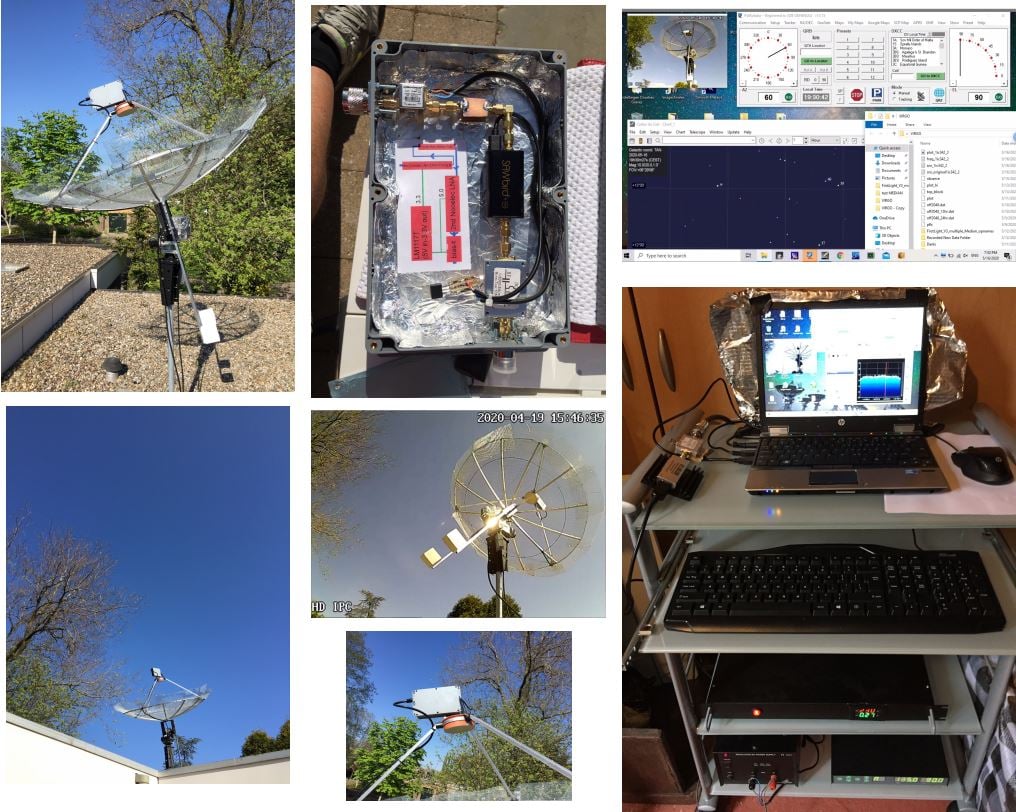
We've recently been testing methods to help budding amateur radio astronomers get into the hobby cheaply and easily. We have found that a low cost 2.4 GHz 100 cm x 60 cm parabolic WiFi grid antenna, combined with an RTL-SDR and LNA is sufficient to detect the hydrogen line peak and doppler shifts of the galactic plane. This means that you can create backyard hydrogen line radio telescope for less than US$200, with no complicated construction required.

If you don't know what the hydrogen line is, we'll explain it here. Hydrogen atoms randomly emit photons at a wavelength of 21cm (1420.4058 MHz). Normally a single hydrogen atom will only very rarely emit a photon, but the galaxy and even empty space is filled with many hydrogen atoms, so the average effect is an observable RF power spike at ~1420.4058 MHz. By pointing a radio telescope at the night sky and averaging the RF power over time, a power spike indicating the hydrogen line can be observed in a frequency spectrum plot. This can be used for some interesting experiments, for example you could measure the size and shape of our galaxy. Thicker areas of the galaxy will have more hydrogen and thus a larger spike, whereas the spike will be significantly smaller when pointing at empty space. You can also measure the rotational speed of our galaxy by noting the frequency doppler shift.

The 2.4 GHz parabolic WiFi grid dishes can be found for a cheap at US$49.99 on eBay and for around US$75 on Amazon. Outside of the USA they are typically carried by local wireless communications stores or the local eBay/Amazon equivalent. If you're buying one, be sure to get the 2.4 GHz version and NOT the 5 GHz version. If you can find 1.9 GHz parabolic grid dish, then this is also a good choice. Although we haven't tested it, this larger 2.4 GHz grid dish would probably also work and give slightly better results. WiFi grid antennas have been commonly used for GOES and GK-2A geosynchronous weather satellite reception at 2.4 GHz with RTL-SDRs as well and we have a tutorial on that available on our previous post.

These dishes are linearly polarized but that is okay as hydrogen line emissions are randomly polarized. Ideally we would have a dual polarization (NOT circular polarized) feed, but linear appears to be enough and is much simpler. In addition, the 2.4 GHz feed is obviously not designed for 1420 MHz, but just like with GOES at 1.7 GHz the SWR is low enough that it still works.

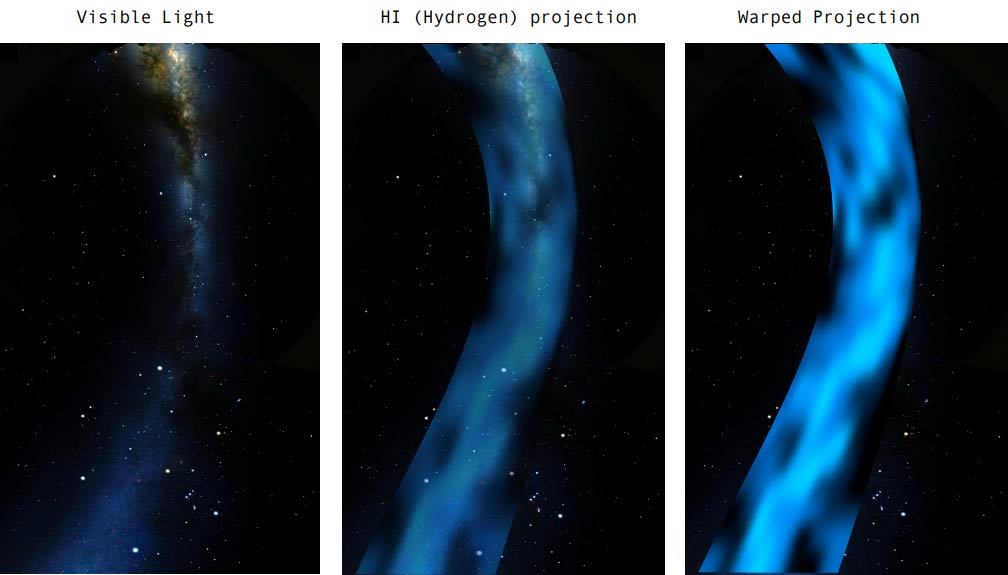
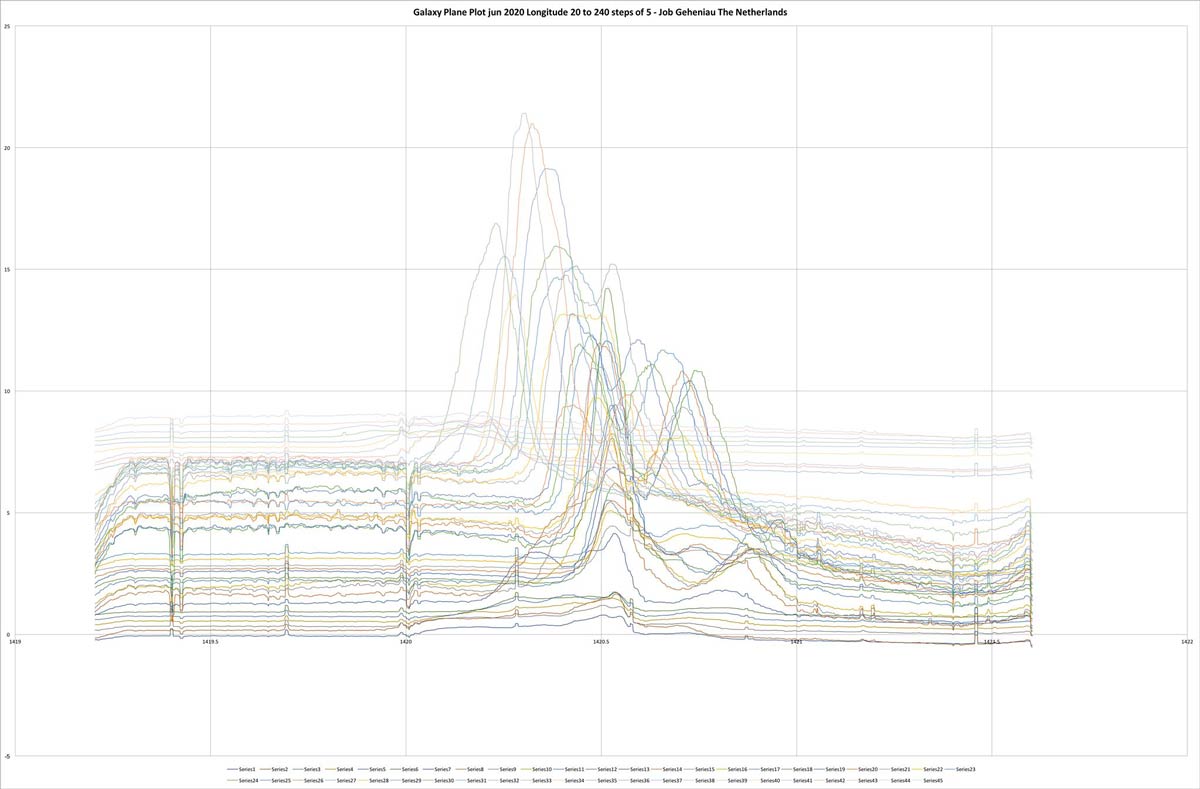
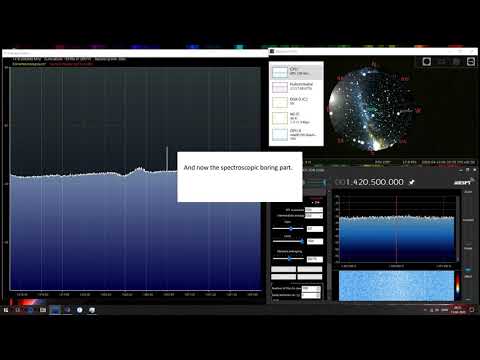
The animation below shows a hydrogen line "drift" scan performed with the 2.4 GHz WiFi dish, an RTL-SDR Blog V3 and a NooElec SAWBird H1 LNA. The scan is performed over one day, and we simply let the rotation of the earth allow the Milky Way to drift over the antenna. The Stellarium software on the left shows the movement of the Milky Way/galactic plane over the course of a day for our location. The dish antenna points straight up into the sky, and we have set Stellarium to look straight up too, so Stellarium sees exactly what our dish antenna is seeing.


You can clearly see that there is a lump in the radio spectrum at around 1420.40 MHz that grows when parts of the Milky Way pass over the antenna. This lump is the hydrogen line being detected. As our Milky Way galaxy is filled with significantly more hydrogen than empty space, we see a larger lump when the antenna points at the Milky Way, and only a very small lump when it points away.

It's important to ignore the very narrowband spikes in the spectrum. These narrowband spikes are simply radio interference from electronics from neighbors - probably TVs or monitors as we note that most of the interference occurs during the day. There is also a large constant spike which appears to be an artifact of the LNA. The LNA we used has a 1420 MHz filter built in, but LCD TVs and other electronics in today's suburban environment spew noise all across the spectrum, even at 1420 MHz.

You can also note that the hydrogen line peak is moving around in frequency as different parts of the galaxy pass overhead. This indicates the doppler shift of the part of the galaxy being observed. Because the arms of the galaxy and the hydrogen in it is rotating at significant speeds, the frequency is doppler shifted relative to us.

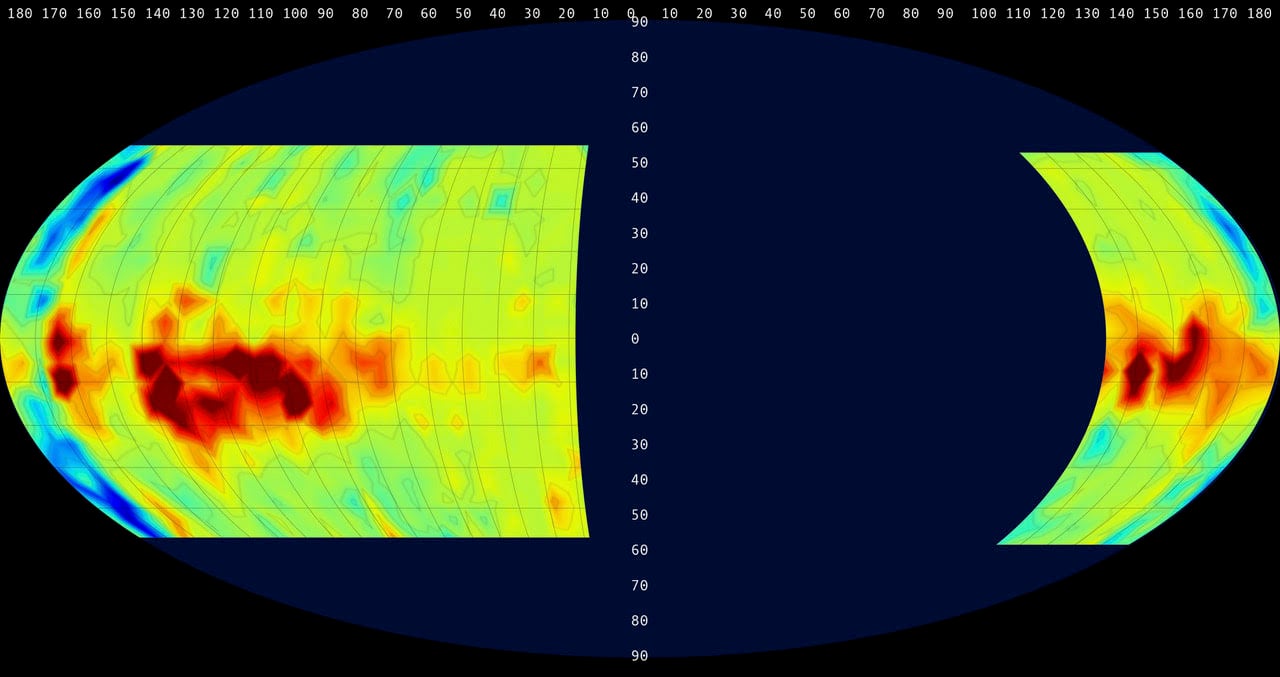
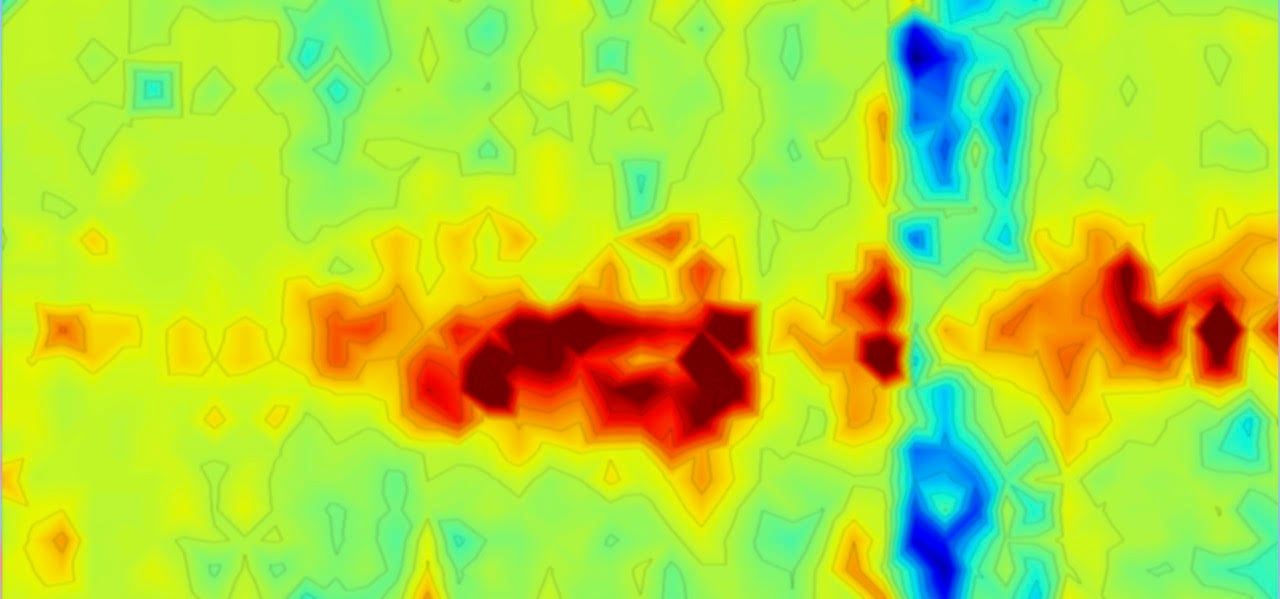
Using the power and doppler shift data of the hydrogen line is how astronomers first determined the properties of our galaxy like shape, size and rotational speed. If we continued to scan the sky over a few months, we could eventually build up a full map of our galaxy, like what CCERA have done as explained in this previous post.

Continue reading

A Hydrogen Line Telescope Made from Cereal Boxes and an RTL-SDR

SpaceAustralia.com have recently been hosting a community science project that involves encouraging teams to build backyard radio telescopes that can detect the arms of our Milky Way Galaxy by receiving the Hydrogen line frequency of 1420 MHz.

This can be achieved at home by building a horn antenna out of cardboard and aluminum foil, and a feed from a tin can. Then the Hydrogen line and galactic plane can be detected by using an RTL-SDR, LNA, and software capable of averaging an FFT spectrum over a long period of time.

While most horn antennas are typically made from four walls, one participant, Vanessa Chapman, has shown that even trash can be used to observe the galaxy. Vanessa's horn antenna is made from multiple cereal boxes lined with aluminum foil and an old tin fuel can. The boxes are held together by some string and propped up by some sticks.

With her cereal box horn antenna combined with an RTL-SDR Blog V3, and an RTL-SDR Blog Wideband LNA, Vanessa was able to use software to average the spectrum over time as the galactic plane passed overhead, revealing the Hydrogen line peak and corresponding doppler shift from the galactic plane.

Vanessa's Hydrogen Line Radio Telescope made from Cereal Boxes

If you don't know what the Hydrogen line is, we'll explain it here. Hydrogen atoms randomly emit photons at a wavelength of 21cm (1420.4058 MHz). Normally a single hydrogen atom will only very rarely emit a photon, but space and the galaxy is filled with many hydrogen atoms so the average effect is an observable RF power spike at 1420.4058 MHz. By pointing a radio telescope at the night sky and integrating/averaging the RF power over time, a power spike indicating the hydrogen line can be observed in a frequency spectrum plot. This can be used for some interesting experiments, for example you could measure the size and shape of our galaxy. Thicker areas of the galaxy will have more hydrogen and thus a larger spike, whereas the spike will be significantly smaller when not pointing within the galactic plane. You can also measure the rotational speed of our galaxy by noting the frequency doppler shift.

Creating a 21cm Galactic Sky Map with an Airspy and 1.8m Dish

Marcus Leech from ccera.ca is a pioneer in using low cost software defined radios for observing the sky with amateur radio telescopes.  In the past he's shown us how to receive things like the hydrogen line,  detect meteors and observe solar transits using an RTL-SDR. He's also given a good overview and introduction to amateur radio astronomy in this slide show.

His recent project has managed to create a full Hydrogen sky map of the northern Canadian sky. In his project memo PDF document Marcus explains what a sky map shows:

A [sky map] shows the brightness distribution over the sky for a given set of observing wavelengths. In the case of the 21cm hydrogen line wavelength, maps show the distribution of hydrogen over the sky. For amateur observers, such maps generally show the distribution within our own galaxy, since extra-galactic hydrogen is considerably more faint, and significantly red/blue shifted relative to the rest frequency of 1420.40575 MHz, due to relative motion between the observer and the target extra-galactic hydrogen.

He was able to make this observation using his radio telescope made from a 1.8m dish antenna, a NooElec 1420 MHz SAWBird LNA + Filter, a 15dB line amplifier, another filter and two Airspy R2 software defined radios locked to an external GPSDO. The system runs his custom odroid_ra software on an Odroid XU4 single board computer, which provides spectral data to an x86 host PC over an Ethernet connection. 

Over 5 months of observations have resulted in the Hydrogen sky map shown at the end of this post. Be sure to check out his project memo PDF file for more information on the project and how the image was produced. Marcus' blog post over on ccera.ca also notes that more data and different maps will be produced soon too.

Hydrogen Sky Map
Hydrogen Sky Map

Updates on the PICTOR Low Cost Open Source Radio Telescope Based on RTL-SDR

Back in July we posted about PICTOR, an open source and RTL-SDR based radio telescope project. The owner of the project recently wrote in and wanted to share some updates. His text is below:

A few months ago, PICTOR was launched. PICTOR is a free to use open source radio telescope that allows anyone to observe the sky in the 1300~1700 MHz range at any time via the easy-to-use online platform.

The goal of this effort is to introduce students, educators, astronomers and others to the majesty of the radio sky, promoting radio astronomy education, without the need of building a large and expensive radio telescope. 

Since the initial launch, PICTOR has gotten lots of updates and improvements, particularly in the software backend, providing more data to the users, using advanced techniques to increase the signal-to-noise ratio by calibrating spectra and mitigating radio frequency interference (RFI) (if present).

Here is an example observation with PICTOR, clearly showing the detection of 3 hydrogen-dense regions corresponding to 3 unique spiral arms in the Milky Way!

Graphs from the PICTOR RTL-SDR Radio Telescope showing the 3 unique spiral arms in the Milky Way.

If you’re new to radio-astronomy, the developer of PICTOR has provided a PDF including some introductory radio astronomy information and instructions on how to observe the radio sky with PICTOR: https://www.pictortelescope.com/Observing_the_radio_sky_with_PICTOR.pdf

Building An Open Source SDR Based Hydrogen Line Radio Telescope

Over on Reddit we've seen a post by u/ArtichokeHeartAttack who has been working on a hydrogen line radio telescope, based on an RTL-SDR dongle and horn antenna designs by the DSPIRA program, and the Open Source Radio Telescopes website (site appears to be down, linked to the archive.org copy). [u/ArtichokeHeartAttack] has documented their radio telescope building journey, providing a comprehensive top-level document that is able to point interested people in the right direction towards understanding and building their own Hydrogen line radio telescope.

Briefly, their build consists of a horn antenna and reflector designed for the 1,420.4 MHz Hydrogen line frequency. The horn is built out of a few pieces of lumbar, metallic house wall insulation sheets and aluminum tape. The feed is made from a tin can and piece of wire. In terms of radio hardware, they used an Airspy SDR, GPIO labs Hydrogen Line Filter + LNA, and 2x Uputronics Wide band preamps, and a Minicircuits VBF-1445+ filter. For software processing, they used a GNU Radio flowgraph to integrate and record the spectrum.

The results show that they were able to achieve a good hydrogen line peak detection, and they were able to measure the galactic rotation curve doppler shift, and tangent points which prove that we do in fact live in a spiral galaxy.

The Finished Hydrogen Line SDR Based Horn Radio Telescope Antenna

PICTOR: An Open Source Low Cost Radio Telescope based on RTL-SDR

PICTOR is an open source and open hardware radio telescope that aims to promote radio astronomy on a budget. It consists of a 1.5 meter parabolic dish antenna, 1420 MHz feedhorn, a two stage low noise amplifier (LNA), high pass filter, and from what we gather, an RTL-SDR. Future designs may also use higher bandwidth SDRs. Currently there doesn't seem to be much information about the build and exact components used in their design, but we're hoping that those details will come in time.

The radio telescope allows a user to measure hydrogen line emissions from our galaxy. Hydrogen atoms randomly emit photons at a wavelength of 21cm (1420.4058 MHz). The emissions themselves are very rare, but since our galaxy is full of hydrogen atoms the aggregate effect is that a radio telescope can detect a power spike at 21cm. If the telescope points to within the plane of our galaxy (the milky way), the spike becomes significantly more powerful since our galaxy contains more hydrogen than the space between galaxies. Radio astronomers are able to use this information to determine the shape and rotational speed of our own galaxy.

PICTOR also has a very interesting web based interface which can be used to let users from anywhere in the world access the telescope and log an observation. The first PICTOR telescope is currently online and observations can be created simply by going to their website, and clicking on the "Observe" link. Users can then enter the frequency and other parameters for their observation, and the resulting graph will be emailed to you after the observation. The software source is available on their GitHub page, and is based on a GNU Radio flowgraph and Python plot script.

For more information about PICTOR, logging an observation, and radio astronomy in general, we recommend checking out their PDF guide. We test ran a short observation at the hydrogen line frequency, and we received a graph with the hydrogen line peak clearly visible (spliced in to the photo below). We note that the wavy shape is due the to shape of the filters they used.

PICTOR Radio Telescope

Radio Astronomers listen to the Early Universe at 78 MHz with a Dipole and Custom SDR

Radio astronomers from Arizona State University and MIT have recently observed a predicted radio phenomenon that originates from the very first stars formed in the Universe.

Hydrogen tends to emit radio signals in the 21cm (1.4 GHz) region of the frequency spectrum. An emission from a single Hydrogen atom is very rare, but since there is so much Hydrogen in space a bump at 1.4 GHz can be observed on the frequency spectrum if a sensitive radio is used with a directional antenna pointing up at the sky. This is a moderate difficulty experiment that can be performed by amateur radio astronomers today with cheap RTL-SDRs or other SDRs together with some LNAs. 

The astronomers in this experiment focus on a distortion in the 21cm line signal that is expected to have been created when the first stars formed. The their paper they write:

After stars formed in the early Universe, their ultraviolet light is expected, eventually, to have penetrated the primordial hydrogen gas and altered the excitation state of its 21-centimetre hyperfine line. This alteration would cause the gas to absorb photons from the cosmic microwave background, producing a spectral distortion that should be observable today at radio frequencies of less than 200 megahertz.

The results show a successful detection of the expected phenomena at 78 MHz, confirming the age at when the first stars have been predicted to have begun forming. The phenomena is detected at 78 MHz instead of 1.4 GHz because the wavelength of a Hydrogren line signal gets stretched the further the source is from us, due to the redshift doppler effect from the expansion of the Universe. This detection is from some of the furthest (and thus oldest) stars in the Universe, so a big stretch is expected.

The experiment consisted of a broadband blade dipole which was set up in the Australian outback. Since the cosmic signal is expected to be detected right in the middle of the broadcast FM band, a dedicated radio-quiet location is required to stand any chance of detection. The receiving SDR hardware consists of an LNA, line amp, filtering and a 14-bit ADC that is connected to a PC.

It seems possible that this experiment could be repeated by amateur radio astronomers with commercial SDR hardware, but the biggest challenge would probably be finding a very radio-quiet location without broadcast FM radio signals.

The 78 MHz Cosmic Signal SDR Detection Setup
Dipole antenna with 30mx30m ground plane