Tagged: rtl2832u

Hak5: Exploring With The PortaPack and HDSDR

In this Hak5 episode Darren discusses the HackRF PortaPack which is a portable LCD screen device that connects to a HackRF SDR and allows portable frequency spectrum visualization. The PortaPack is currently under development and in the future it will allow demodulation of multiple audio modes and possibly digital demodulation and recording capabilities as well.

Later in the episode Shannon presents a tutorial on HDSDR, an SDR GUI alternative to SDR#. She shows how to install and use the HDSDR program.

Updates on Keenerds RTL-SDR Improvement Project

If you didn’t already know Keenerd (aka Kyle Keen), author of rtl_fm, rtl_power, rtl_adsb and rtl_sdl is having a fundraiser to raise funds to pay for a month of RTL-SDR improvement programming. As of the time of this post we’re about halfway through the fundraiser’s 30 day time limit and it has already generated $2,260 USD out of the minimum desired $3000 USD. Keenerd has also written a report on the status of the fundraiser so far.

Remember that the more funds raised, the more time he will have to work on the software meaning a better RTL-SDR experience for everyone. (Note that the improvements are for Windows, Mac and Linux).

Having raised this much already Keenerd has begun work and has already made some improvements to the RTL-SDR drivers based on Teejeez’s work. A list is shown below.

  • dithering[3] – Possibly the secret sauce to phase aligned multiple dongles. I don’t have the setup to operate this or the math to confirm. rtl_sdr -N or rtlsdr_set_dithering() to access it.
  • IF freq and bandwidth filters[4] – Extend the HF range somewhat. Less out-of-band aliasing.
  • register caching[5] – Don’t re-send values that have not changed. Slightly modified the noise floor in my tests, which it should not have.
  • register batching[6] – Delay changing registers until a command finishes, then send them all.
  • cache i2c repeater[7] – Normally the i2c port is enabled and disabled between every single byte. Leave it open while its in use.
  • pll tweaks[8] – People smarter than me wrote these, and it didn’t seem to make anything worse. Might also extend the HF range.

See the original Reddit thread discussing these improvements here and here for a link to the GitHub download page. Note that at the moment you will need to compile the drivers yourself.

New Japanese HF Upconverter for the RTL-SDR

A new HF upconverter designed for the RTL-SDR has gone up on ttrftech’s Japanese language blog (use Google Translate). The upconverter is called the ‘SC-HFCONV-100’ and comes with 100 MHz oscillator, SMA connectors, USB mini-B power.

Currently the upconverter is only available for sale on the Japanese Amazon store, but it is possible to still order it through the jzool-agent Japanese shopping service.

Japanese HF Upconverter

RTL_POWER Heatmap Viewer

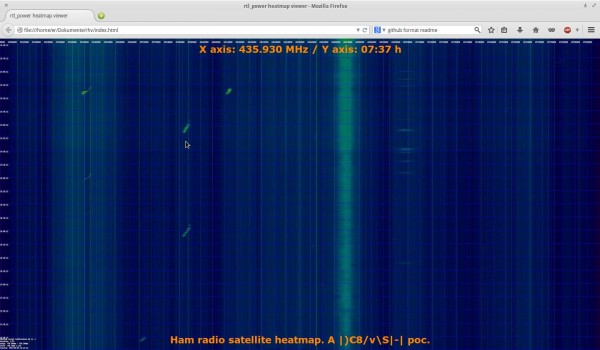
Back in June we posted about DE8MSH’s rtl_power based heatmap viewer which was automatically generated every day from a Raspberry Pi. The browser based heatmap display provides a way to view the frequency and time of where the mouse pointer is allowing you to easily identify signals.

Back then the code was unavailable but now DE8MSH has released his code on GitHub. An example heatmap generated by the code can be found here.

RTL_POWER Heatmap Viewer

Triangulation of a VHF Signal with RTLSDR-Scanner

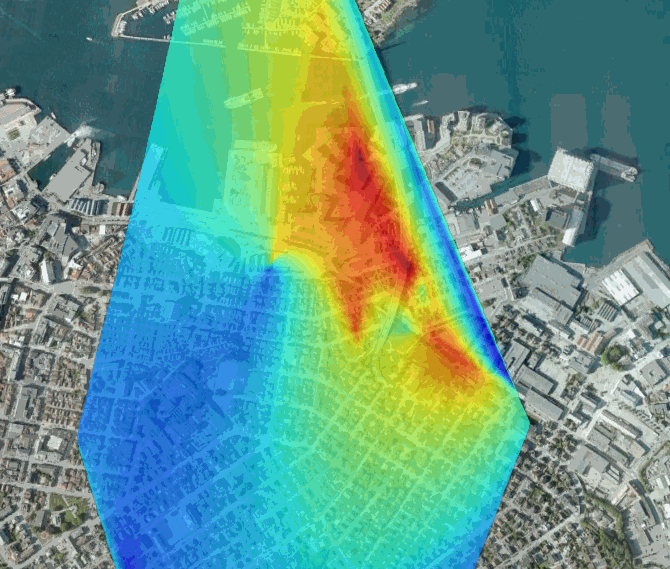
A few months back we posted about how the the RTLSDR-Scanner software had been updated to include signal triangulation capabilities. Now blogger Tobby has written a post about his attempt at triangulating the source of an encrypted police signal with RTLSDR-Scanner.

To do this he set up a laptop in his car with RTLSDR-Scanner installed and connected his RTL-SDR with stock antenna and a GPS receiver. After driving around for only 15 minutes he was able to get a triangulation heat map of reasonable accuracy.

RTLSDR-Scanner Signal Triangulation Heatmap

RTL_POWER Instructions

A new instructional page for the rtl_power tool is now available on main author keenerds webpage. Rtl_power is a command line tool for logging wide band frequency power scans to a CSV file. The CSV files can then be used for analysis or to create a large frequency plot image. An example of a 2 GHz+ bandwidth scan over 24 hours is shown below. Rtl_power is available as part of the official osmocom RTL-SDR drivers.

Example scan over an E4000 dongles entire frequency range.

Radio Astronomy with RTL Bridge and Radio-Sky Spectrograph

Amateur radio astronomy hobbyist Jim Sky has written on his blog about his new program called RTL Bridge with allows the RTL-SDR to directly connect to his other radio astronomy programs Radio-SkyPipe and Radio-Sky Spectrograph. Jim describes his two existing program as follows.

Radio-Sky Spectrograph displays a waterfall spectrum. It is not so different from other programs that produce these displays except that it saves the spectra at a manageable data rate and provides channel widths that are consistent with many natural radio signal bandwidths. For terrestrial , solar flare, Jupiter decametric, or emission/absorption observations you might want to use RSS.

Radio-SkyPipe is a souped-up strip chart program which plots signal strength over time. When getting its data from RTL Bridge, RSP is plotting the total power in the spectrum covered by the RTL receiver centered around its set frequency. While the raw values are proportional to power, you will have to apply a function via the RSP Equations feature to apply a calibration if you want absolute values. For signals that do not have significant spectral structure of interest, this would be the preferred way to plot the data.

RTL Bridge for Radio Astronomy

3D Frequency Spectrum Visualization with Chrome and RTL-SDR

Over on ttrftech’s blog in Japanese (use Google translate), ttrftech has uploaded a new RTL-SDR program for Chrome which allows 3D visualization of the frequency spectrum. The program can be installed by simply downloading the files from GitHub and loading them into Chrome. Ttrftech explains that the program should work on any OS, but he has so far only been able to test it on MacOS.

Chrome 3D Frequency Spectrum for RTL-SDR