Over on Reddit, user tautology2 has linked to his project which is software that can create a heatmap of signal strengths. His software uses the data that is output from RTLSDR Scanner which is a program that will collect signal strength data over any desired bandwidth and at the same time also record GPS coordinates using an external GPS receiver. RTLSDR Scanner can also create a heatmap by itself, but tautology2’s heatmap is much clearer and has good web controls for choosing the heatmap signal frequency.
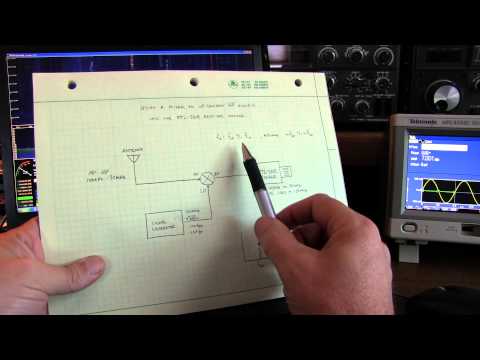
Over on YouTube user w2aew has uploaded a tutorial video that clearly explains the theory behind upconverters. Upconverters are commonly used with the RTL-SDR to receive the HF (0 – 30 MHz) bands. In the video he shows how to make a simple homemade double-balanced diode ring mixer for the RTL-SDR and shows its performance in HDSDR.
#174: Using a mixer to listen to HF, shortwave, ham, etc. on RTL-SDR dongle
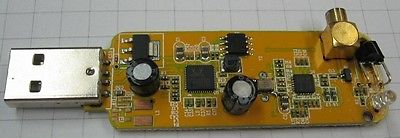
Previously on our blog we posted about RTL-SDR dongles for sale in Japan that had been modified by replacing the low quality 28.8 MHz oscillator with a quality low ppm and high stability temperature controlled oscillator (TCXO).
Now there is a new USA based source for modified TCXO dongles over on Ebay. The new dongles are modified with a 1 ppm high stability TCXO and sell for $65 USD. The manufacturer of these modded dongles has been kind enough to send us a sample and we will have a review of the product up in a few days.
The oscillator on the RTL-SDR is prone to thermal drift, which means that as the dongle heats up from use, the frequency you are tuned to may change over time. A TCXO compensates for differences in temperature and thus keeps the frequency stable as the temperature changes.
Dump1090 is a command line based ADS-B decoder for the RTL-SDR. It is considered by many to be the best ADS-B decoder for the RTL-SDR available at the moment. Dump1090 is most commonly used in Linux but over on his blog, SonicGoose has written a tutorial that shows how to use dump1090 on Windows with the popular PlanePlotter software. He also shows how to use ModeSMixer2, which is another command line utility that is used to combine data from multiple ADS-B decoders and then rebroadcast the combined feed.
SonicGoose writes that the reason that many PlanePlotter users are moving away from the simpler GUI based RTL1090 ADS-B decoder is because dump1090 provides better raw data to use for multilateration. Multilateration is a technique supported by PlanePlotter which used data shared from multiple receivers to determine the location of an aircraft, even if that aircraft is not transmitting location information.
Over on the Google Play store there is a new (released July 2014) RTL-SDR ADS-B Android app available for purchase called “ADS-B Receiver”. This app allows you to with the aid of an RTL-SDR and USB OTG cable, display live aircraft ADS-B data on your Android phone. This app can also be used to display the live ADS-B data in another app called “Avare”, which provides offline FAA aviation charts and other pilot tools on a Android phone.
The app can be downloaded as a trial version with a fixed limit on the number of packets allowed to be received, or the pro version for around $1.99 USD with no limits.
Previously on this blog we mentioned another similar RTL-SDR Android ADS-B app called “ADS-B on USB SDR RTL“.
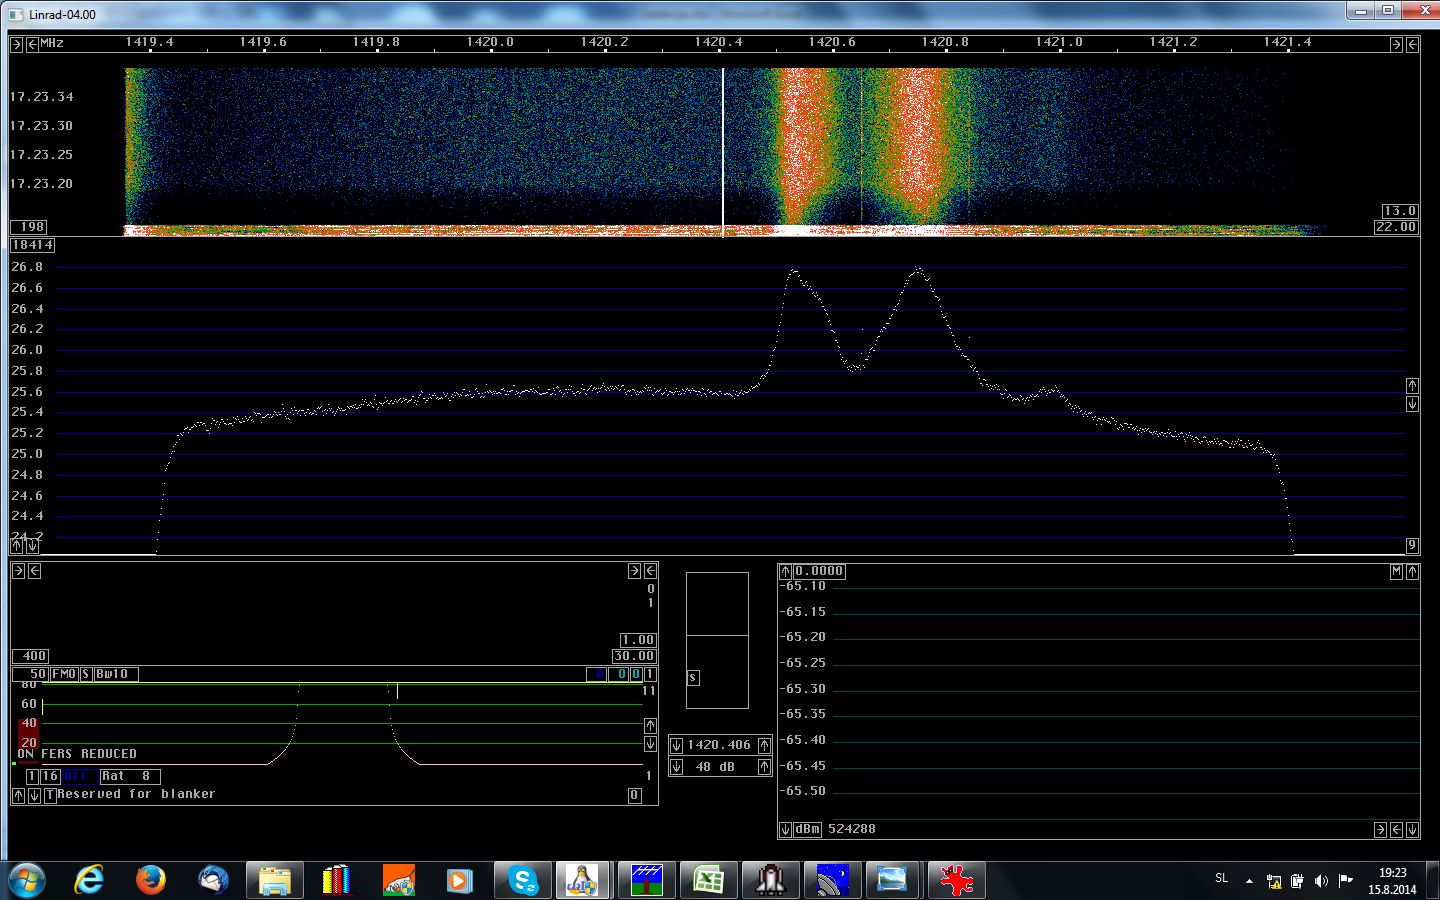
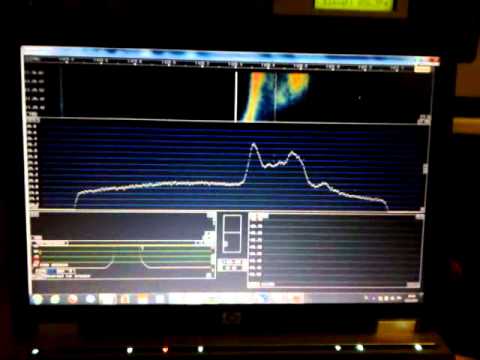
Over on YouTube user S53RM has uploaded a video showing his and S53MM’s observation of the 1420 MHz galactic hydrogen line with an RTL-SDR. Hydrogen atoms randomly emit photons at a wavelength of 21cm (1420.4058 MHz). Normally a single hydrogen atom will rarely emit a photon, but since space and the galaxy is filled with many hydrogen atoms the average effect is an observable RF power spike at 1420.4058 MHz. By pointing a radio telescope at the night sky, a power spike indicating the hydrogen line can be observed in a frequency spectrum plot.
In the video they rotate their 3.6m parabolic mesh antenna dish along the Milky Way. As the dish rotates doppler shifted hydrogen line peaks can be observed on Linrad, each peak representing a different arm of the galaxy. The galaxy consists of several spinning arms, some spinning faster than others which causes the hydrogen line peaks produced by the arms to be doppler shifted by different amounts.
They used Linrad to plot the RF spectrum as they were able to use it together with a pulse generator to calibrate the RTL-SDR for a flatter frequency response.
Contribution involves running an ADS-B decoder like RTL1090, sending the decoded data to Virtual Radar Server (VRS) and then using VRS to rebroadcast the data to their Mode-S Logger software.