Automatic Heatmap Logging on a Raspberry Pi using an RTL-SDR and RTL_POWER
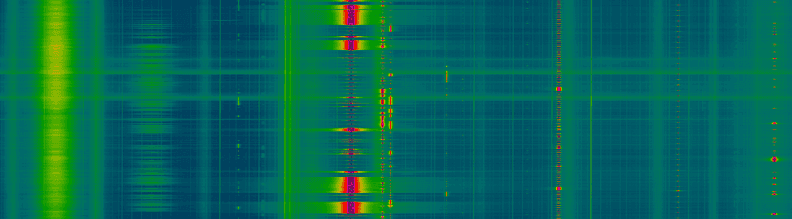
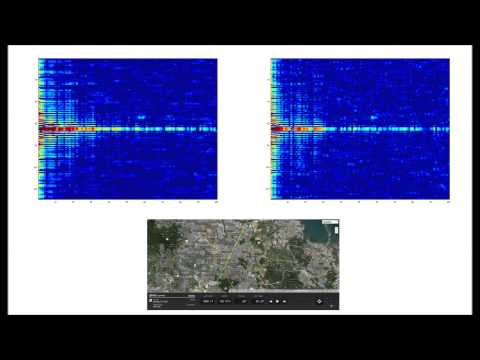
Amateur radio hobbyist DE8MSH recently wrote in to let us know about a project he has been working on. His project involves using a Raspberry Pi B and RTL-SDR to automatically log a wide band heatmap using rtl_power. Rtl_power is a command line tool that will log signal strengths to a csv file using the RTL-SDR over a very large definable bandwidth.
To do the automatic logging the Raspberry Pi runs rtl_power for 23 hours constantly writing data to a mounted hard drive. After 23 hours the heatmap image is calculated and then uploaded to a webpage at http://qth.at/de8msh/
DE8MSH has also been working on a second related project over at http://www.qth.at/de8msh/hm/pic.html. The heatmap on this page shows various transmissions from weather balloons. As you mouse over those transmissions, the QTH (location) of those weather balloon transmissions is shown as well as the frequency and time of where the mouse pointer currently is.