Tagged: rtl_power

A Video Introduction to Broadband Surveillance with RTL_POWER

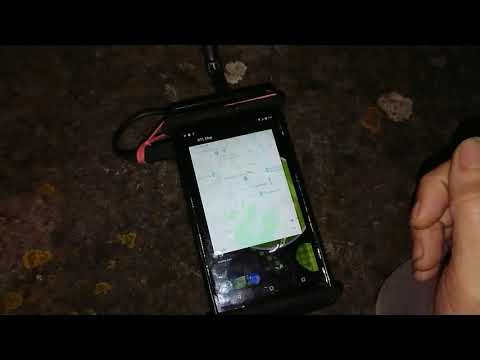
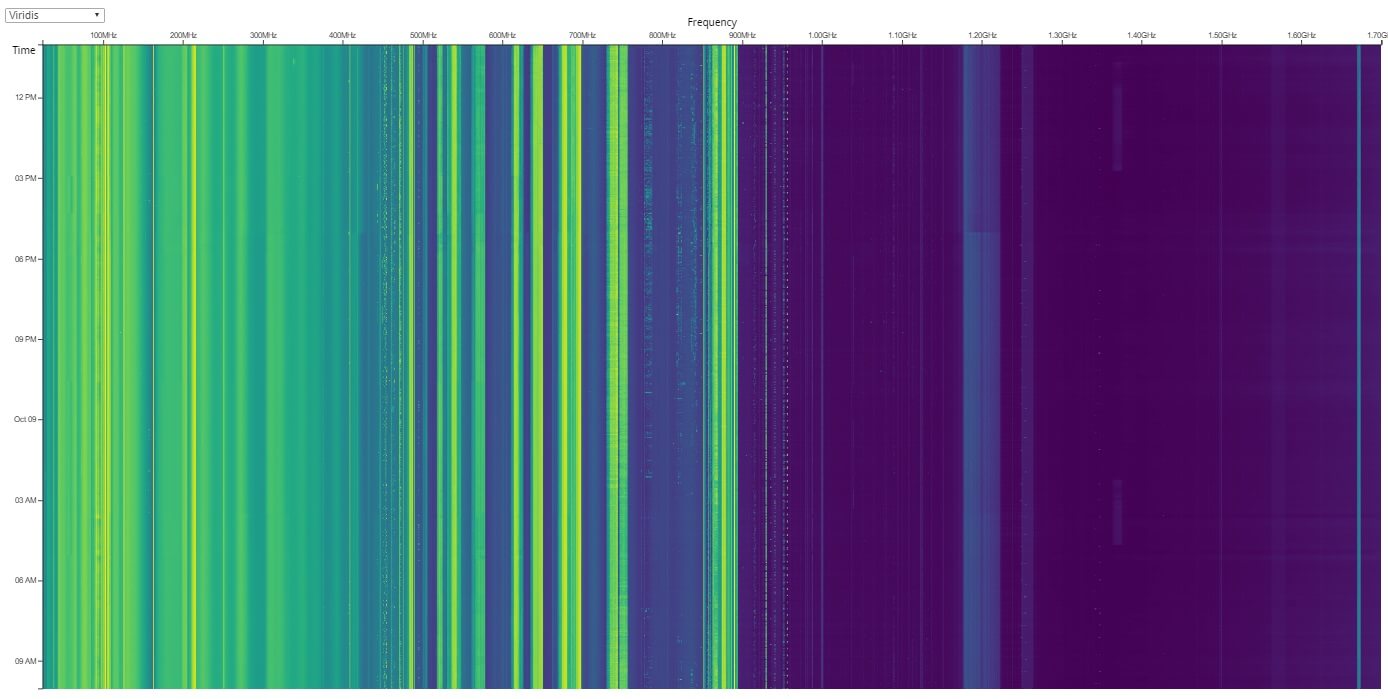
Over on YouTube "Mount Lethe Hellfire" has recently uploaded a video showing a deep dive into the rtl_power tool. rtl_power enables users to generate wide-spectrum displays by rapidly sweeping the RTL-SDR’s center frequency across the desired frequency range.

In this video I do a deep-dive into the command line tool, rtl_power, which is a purpose built headless RF broadband spectrum scanner. I dive into the command line, its use cases as it pertains to SIGINT (COMINT, ELINT), and finally do a live demo. Additionally, I provide some other ways to access your DragonOS running on Raspberry Pi with VSCode as well as troubleshooting issues with USB claims on Linux.

Broadband SIGINT Surveillance with RTL-SDR & rtl_power

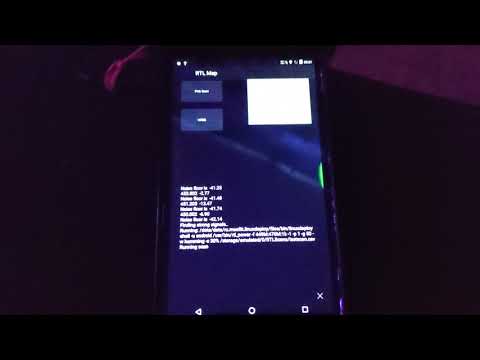
In a second video, Mount Lethe Hellfire continues this topic and goes on to show how rtl_power can be combined with visualization and scripting for powerful RF spectrum analysis.

In this video I walk you through how to use a Python script (running on DragonOS, or otherwise) that will process rtl_power SSV outputs, normalize the data points, and assist you in visualization as well as local analysis using Structure Query Language (SQL) with DuckDB. The SQL analysis is to pull out the Top 10 frequencies sorted by dBm, nothing too crazy but enough to inform you on further ELINT and COMINT collection, processing, exploitation, and analysis efforts.

Analyze & Visualize RF Spectrum with rtl_power and Python scripting | ft. RTL-SDR

Combining Android Tasker and an RTL-SDR for Mobile Automated Frequency Power Scans

Over on YouTube Ian Grody has uploaded two videos demonstrating an early alpha project that he is working on which combines Android Tasker with RTL-SDR frequency scanning. Tasker is an Android automation app which allows users to define a task based on a context. For example, you could set it to turn on WiFi and open an app (task) every time you arrive at a certain location (context).

Ian's idea is to create a Tasker application that performs an rtl_power scan with the RTL-SDR whenever a certain context is detected. The current version of his Tasker app can perform an rtl_power scan over a certain frequency range at the tap of a button, detect the strongest frequencies in that range, and plot a marker at the current location on a Google map which displays the strongest frequency detected at that location. He eventually hopes to turn the application into a wardriving application that will scan 27 MHz - 1.7 GHz for active signals while on the move.

His Tasker alpha application is available via the link on his Reddit post.

Tasker and a Software Defined Radio

Tasker and an RTL SDR - Part II

Fingerprinting Electronic Devices via their RF Emissions with an RTL-SDR and ImageMagick

Thank you to José Carlos Rueda for submitting his simple shell script that he uses for fingerprinting spurious RF emissions with an RTL-SDR, rtl_power, heatmap.py and imagemagick. The result is something like Disney's EM sense created with much simpler code.

It is well known that almost all electronic devices unintentionally emit unique spurious RF signals when in operation. By using an SDR like an RTL-SDR to record the spectra from electronic devices, it's possible to build up a database of known emissions. We can then detect when an electronic device is active by comparing the live spectrum to spectra stored in the database.

In a previous post we covered Disney's EM sense which is an experimental smart watch that automatically detects what electronic device the wearer is touching. With EM Sense they use an RTL-SDR and a database of raw pre-recorded spectrum data. To detect what the wearer is touching the live signal from the RTL-SDR is correlated against the database, and the closest match is returned.

José's script does something very similar, however instead of correlating with raw spectrum data he instead uses the waterfall image that is generated by rtl_power and heatmap.py. The rtl_power program allows an RTL-SDR to scan the frequency spectrum over a wider bandwidth by rapidly scanning ~2.4 MHz chunks of bandwidth at different frequencies. Heatmap.py is a program that turns the scanned data from rtl_power into a heatmap image of the spectrum.

To add an entry to the database, the electronic device is placed 7-8 centimeters away from the RTL-SDR, and a heatmap image recorded between 24 - 921 MHz is saved to disk. This can be repeated for multiple electronic devices. Each image will record the spurious signals from the electronic device, resulting in a unique heatmap image per electronic device.

Once the database has been created, you can then place any of the devices found in the database next to the RTL-SDR, and record a heatmap for 20-30s. That heatmap will then be compared against the images in the database using imagemagick which is an image analysis and manipulation library. The electronic device associated with the closest matching image in the database will be returned.

In his experiments he tested various electronic devices like an iPhone and was able to successfully determine when it was nearby.

Various electronic device spectra waterfall images recorded in the database

rtlSpectrum: A New GUI for rtl_power

Thank you to Andrey for submitting news about the release of his new open source program called "rtlSpectrum". rtlSpectrum is a GUI for rtl_power, which allows you to scan a wide swath of bandwidth with an RTL-SDR dongle. The scan can then be plotted with rtlSpectrum, and peaks of activity can then be determined. Some of the features include:

  • load from .csv file produced by rtl_power
  • run rtl_power directly. it should be available in the $PATH
  • add multiple graphs for analysis
  • subtract one graph from another
  • save/export graph in the rtl_power based format

In particular, the ability to subtract one graph from another is useful for analyzing filters. Andrey has posted about doing this with rtlSpectrum, a noise source and an RTL-SDR V3 over on his blog (note that the blog is in Russian, so please use Google Translate if necessary). He notes how the dynamic range of the RTL-SDR is limited, so that the true blocking power of a filter cannot be determined, but it is enough to see the shape and frequency response.

rtlSpectrum Screenshots

RTLion: The Multipurpose RTL-SDR Framework

Redditor [K3PWN] has recently released his project called “RTLion”. RTLion is a software framework for RTL-SDR dongles that currently supports various features such as a power spectrum plot and frequency scanning. The software can run on a Raspberry Pi 3 and all features are intended to be accessed via an easy to use web browser interface, or via an Android app. The software can also be run with Docker, making it useful for IoT applications.

RTLion project can be described as a framework due to the implementation of various features other than the frequency scanner. The common structure of the project is appropriate for adding new features too. RTLion Framework has a FlaskSocketIO based Web interface which houses it’s features there. Web interface preferred to the command line interface for facilitating the usage and supporting remote operations. Matplotlib used for creating graphs, more specifically pylabpsd(Power Spectral Density) method mostly used for converting the complex samples (stored in a numpy array) to FFT graphs.

Main purpose of the RTLion Framework is creating a framework for RTL2832 based DVB-T receivers and supporting various features such as spectral density visualizing and frequency scanning remotely. These features are provided on the Web interface and accessible via the RTLion server or the RTLion Android App for RTL-SDR & IoT applications.

RTLion - IoT RTL-SDR

All of his code is open source and available on Github. Currently he’s looking for feedback on improving the framework and we are interested to see where this project may lead in the future.

Spektrum SV Mod: RTL-SDR Spectrum Analyzer Software Now with Improved UI

Spektrum is a popular spectrum analyzer program that is used with RTL-SDR dongles. It is based on the command line rtl_power software and is compatible with both Windows and Linux. Thanks to it's easy to use GUI it is an excellent piece of software for scanning and determining where active signals exist, or for measuring filters and antenna SWR with a noise source.

Recently SV8ARJ (George) and SV1SGK (Nick) have been working on extending the original open source Spektrum code. Their improvements focus around the UI and making it more functional and easier to use. Currently the updated branch is in alpha, and they are hoping that any testers could help report bugs, issues and wishes to them. The code is available on their GitHub and the latest Windows test build can be downloaded from their DropBox.

The changelog reads:

  • 2 Cursors for Frequency axis.
  • 2 Cursors for Amplitude axis.
  • Absolute and differential measurements with cursors.
  • Zoom functionality of the cursors's defined area (gain + frequency).
  • Mouse Wheel Gain adjustment on graph (Top area for upper, low area for lower).
  • Mouse Wheel Frequency adjustment on graph (left area for lower frequency, right for upper).
  • Mouse Wheel in the centrer of the graph performs symetric zoom in/out.
  • View/settings store/recall (elementary "back" operation, nice for quick zoomed in graph inspection).
  • Right click positions primary cursors.
  • Right Double Click positions primary cursors and moves secondary out of the way.
  • Left Double Click zooms area defined by cursors (Amplitude + frequency).
  • Left Mouse Click and Drag on a cursor moves the cursor.
  • Middle (mouse wheel) Double Click resets full scale for Amplitude and Frequency.
  • Middle (mouse wheel) Click and Drag, moves the graph recalculating limits accordingly.
  • Reset buttons to Min/Max range next to Start and Stop frequency text boxes.
  • Cursor on/off checkbox now operate on all 4 cursors.
  • ZOOM and BACK buttons.
  • Filled-in graph option (line or area).
  • Display of frequency, Amplitude and differences for all cursors.
  • Modified: Button layout.
  • Fixed: Save/Reload settings on exit/start. IMPORTANT : delete the "data" folder from the installation location if you have it.
  • Filling in graph option (line or area).
Spektrum UI Updates
Spektrum UI Updates

Software for creating an Interactive RTL_POWER Visualization

RTL-SDR.com reader Dominic Chen recently wrote in to let us know about a new piece of software he’s created. The software is called d3-waterfall, and is an interactive web based waterfall display. It takes CSV data from the commonly used rtl_power software and produces an interactive labelled waterfall which can be viewed in a web browser. rtl_power is a program that allows RTL-SDRs to produce signal power scans over an arbitrarily wide swath of bandwidth, by quickly hopping between ~2 MHz chunks of live bandwidth.

Dominics software is built using “d3.js” and HTML5. The waterfall axes are automatically labelled, there are multiple color schemes and there is pan/zoom support. The main feature is that it is mouse interactive, so when you mouse over a frequency it shows what the signal is. The default signal frequency data is taken directly from our sister site sigidwiki.com, so it may not be accurate for your particular area. But the labels are editable, so it can be customized.

An example of a previous scan can be seen on Dominic’s website (note that this is a 65mb link so be careful if you are data restricted). The software can be downloaded from its GitHub page.

The interactive waterfall.

rx_tools: RTL-SDR Command Line Tools (rtl_power, rtl_fm, rtl_sdr) Now Compatible With Almost Any SDR

Developer R. X. Seger has recently released rx_tools which provides SDR independent ports for the popular command line RTL-SDR tools rtl_power, rtl_fm and rtl_sdr. This means that these tools can now be used on almost any SDR, such as the bladeRF, HackRF, SDRplay, Airspy and LimeSDR. If you don’t know what the tools do, then here is a quick break down:

rtl_fm / rx_fm: Allows you to decode and listen to FM/AM/SSB radio.
rtl_sdr / rx_sdr: Allows you to record raw samples for future processing.
rtl_power / rx_power: Allows you to do wideband scans over arbitrarily wide swaths of bandwidth by hopping over and recording signal power levels over multiple chunks of spectrum.

rx_tools is based on SoapySDR which is an SDR abstraction layer. If software is developed with SoapySDR, then the software can be more easily used with any SDR, assuming a Soapy plugin for that particular SDR is written. This stops the need for software to be re-written many times for different SDR’s as instead the plugin only needs to be written once.

rx_power scan with the HackRF at 5 GHz over 9 hours.