Determining the Radiant of Meteors using the Graves Radar
With an RTL-SDR or other radio it is possible to record the echoes of the 143.050 MHz Graves radar bouncing off the ionized trails of meteors. This is called meteor scatter and it is usually used to count the number of meteors entering the atmosphere. Amateur radio astronomers EA4EOZ and EB3FRN decided to take this idea further and synchronised their separate receivers and recordings with a PPS GPS signal in order to determine the radiant of the meteors they detected. They write:
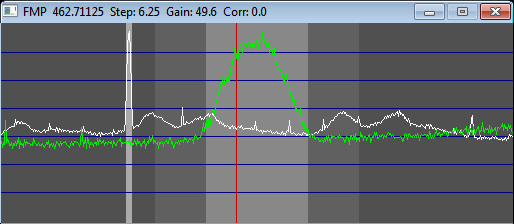
The idea was to analyze the Doppler from the head echoes and and see if something useful can be extracted from them.
We detected a meteor from two distant locations and measured Doppler and Doppler slope at those locations. The we tried to find solutions to the meteor equation by brute force until we obtain a big number of them. Then we plotted those solutions in the sky and we see some of them pass near a known active radiant at the time of observation. Then, we checked the velocity of those solutions near the known radiant and found they are quite similar to the velocity of the known radiant, so we concluded probably they come from that radiant.
But they can come from everywhere else in the sky along the solution lines! There is not guarantee these meteors to be Geminids, although probabilities are high. Once all the possible radiants of a meteor are plotted into the sky, there is no way to know who of all them was the real one. Doppler only measurement from two different places is not enough to determine a meteor radiant. But don’t forget with some meteors, suspect to come from a known shower, the possible results includes the right radiant at the known meteor velocity for that radiant, so there seems to be some solid base fundamentals in this experiment.
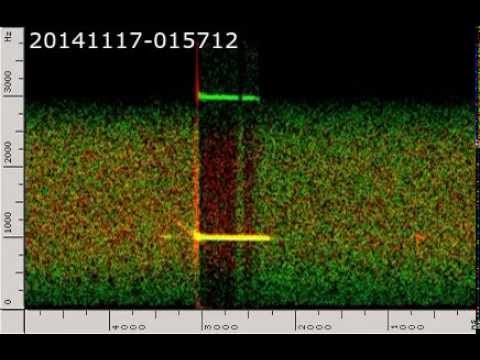
Initially they ran into a little trouble with their sound cards, as it turns out that sound cards don’t exactly sample at their exact specified sample rate. After properly resampling their sound files they were able to create a stereo wav file (one receiver on the left channel, one receiver on the right channel) which showed that the doppler signature was different in each location. The video below shows this wav file.
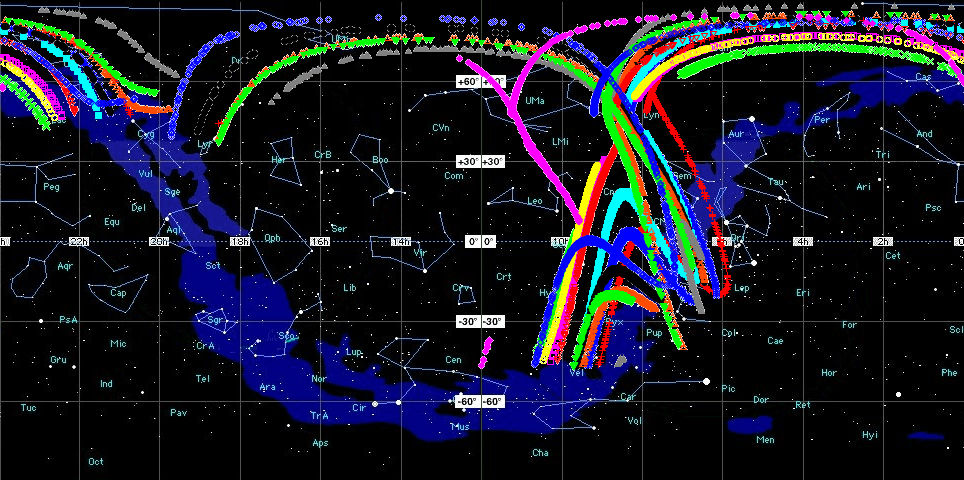
Using the information from their two separate recordings, they were able to do some doppler math, and determine a set of possible locations for the radiant of the meteors (it was not possible to pinpoint the exact location due to there being no inverse to the doppler equation). The radiant of a meteor shower is the point in the sky at which the meteors appear to be originating from. Although their solution couldn’t exactly pinpoint the location, some of the possible solutions from most meteors passed through the known radiant of the Geminids meteor shower. With more measurement locations the exact location could be pinpointed more accurately.