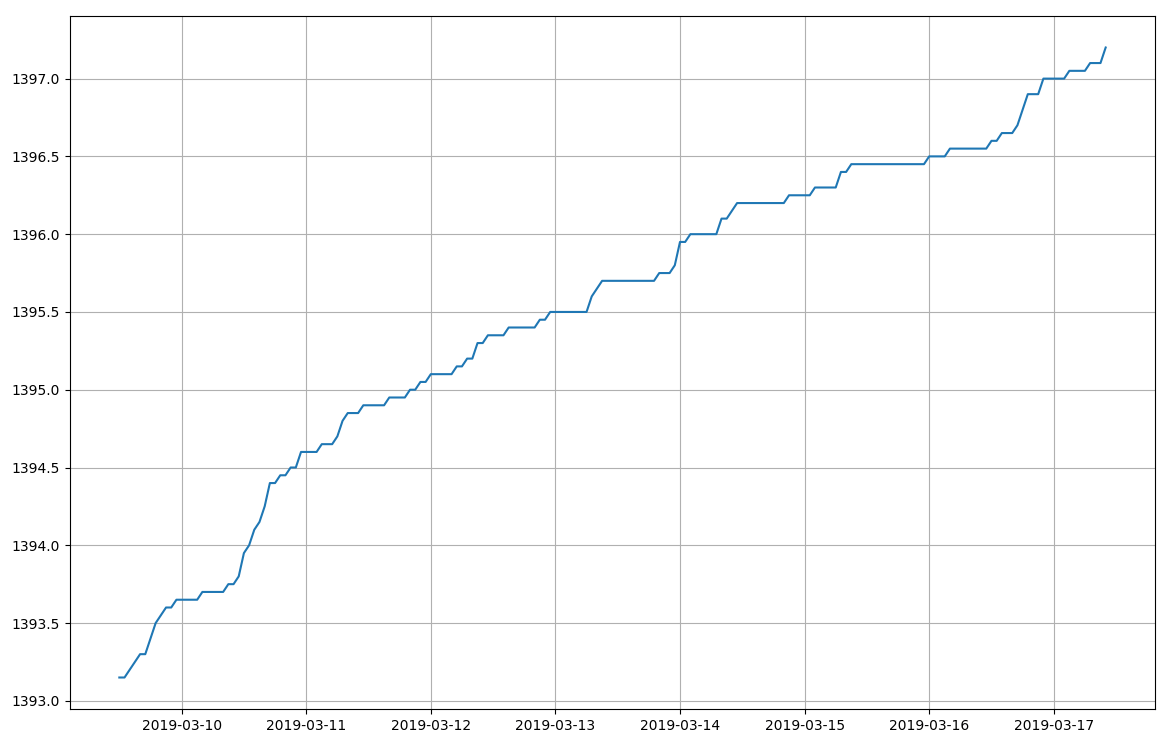
Clayton wrote a simple Python script to plot the usage data extracted by rtlamr, and after a week determined that water was being consumed at 10 liters an hour even while away from home. Suspecting a leak in the toilets he turned off their valves and the next day saw that the reading remained constant when away, indicating that he'd found the leak.
A water leak graphed by decoding an Itron ERT water meter with RTL-SDR
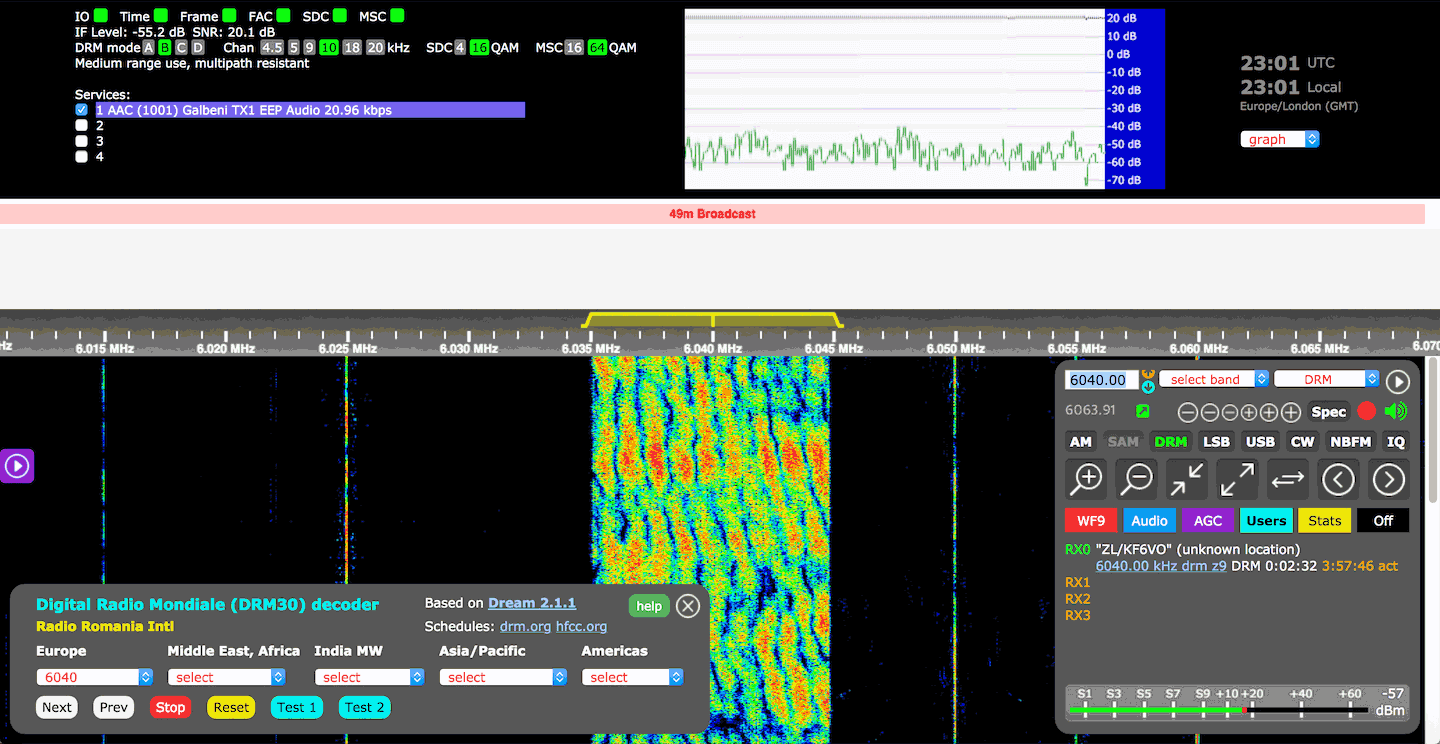
KiwiSDR have recently implemented DRM decoding into their OpenWebRX implementation. Digital Radio Mondiale (DRM) is a type of digital shortwave radio signal that is used by some international shortwave radio broadcasters. It provides superior audio quality compared to AM stations thanks to digital audio encoding.
The KiwiSDR is a US$299 HF SDR that can monitor the entire 0 - 30 MHz band at once. It is designed to be web-based and shared, meaning that the KiwiSDR owner, or anyone that they've given access to can tune and listen to it via a web browser over the internet. Many public KiwiSDRs can be found and browsed from the list at sdr.hu.
The new DRM implementation is based on DREAM 2.1.1 which is an opensource DRM decoder that can be used with any HF capable SDR. Due to computational limits of the BeagleBone singleboard computer which the KiwiSDR runs on, only one DRM channel can be decoded at any one time, restricting this capability to only one user at a time. However, if the KiwiSDR is running on the newer BeagleBone AI, it can support up to four DRM channels. KiwiSDR write that work is still ongoing to improve the code, so this situation may improve in the future.
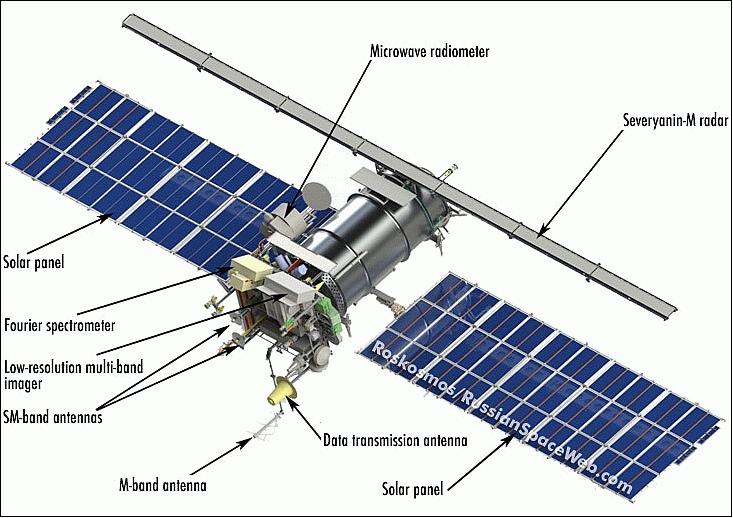
UPDATE: It has now been confirmed by Roscosmos that the satellite was struck by what is presumed to be a micrometeorite which caused a leak of thermal transfer gas, and hence a sudden orbit change. It seems unlikely that the satellite will begin operations again as the satellite cannot operate it's camera sensors without thermal cooling. Data is being transmit currently on the X-Band, however, it appears to be a stored image only, rather than live images.
On December 18, 2019, an abnormal situation was recorded on the Meteor-M spacecraft No. 2-2 associated with an external impact (presumably a micrometeorite) on its structure.As a result, he changed the parameters of the orbit and switched to a non-oriented flight mode with high angular velocities.
In accordance with the inherent logic of operation, the device stopped fulfilling the target task and automatically switched to energy-saving mode when the on-board systems that were not involved in ensuring its functioning (including all on-board target equipment) are turned off.
After entering into the zone of Russian ground-based controls with the Meteor-M spacecraft No. 2-2, communication was established and work began to restore its operability: damping angular velocities, transferring to the standard orientation, receiving telemetric and target information.
Currently, work is underway with the satellite under the program of the chief designer.Meteor-M No. 2-2 is in an oriented flight; regular control sessions are conducted with it to receive telemetric information and information from target equipment.
Meteor M N2-2 is a Russian weather satellite that was successfully launched into orbit on July 5 2019. Like with the NOAA and Meteor M N2 satellites, it is possible to receive weather satellite images from this satellite with an RTL-SDR (when it is operational).
The older but still operational Meteor M2 satellite has failed several times in it's history too, each time with the satellite entering an unstable tumble. However, each time the satellite was recovered back into full operation after a few days.
Message from Happysat Meteor M-N 2-2.Around 17/18 Dec lost orientation. Spent two days getting him back unther control again. Succeeded today. Now analysis is stil being carrieout before it becomes operational again. Why it came is still unknown. Thanks Alex.
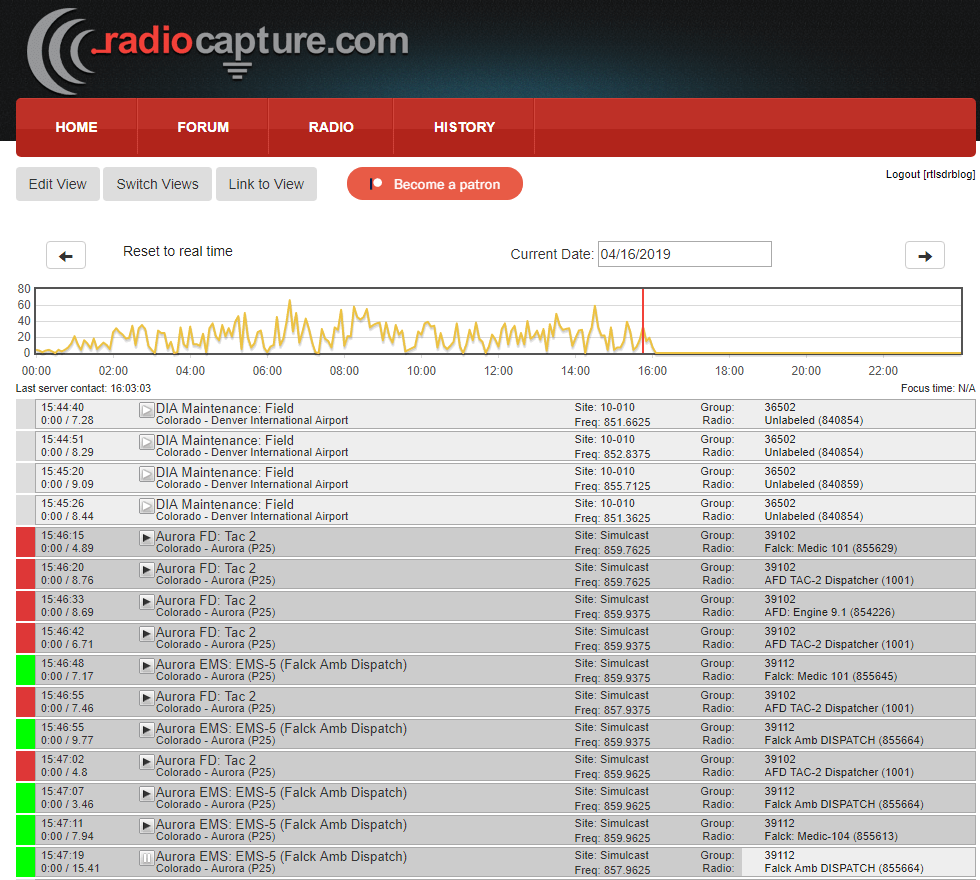
Back in April 2019 we posted about Matt Mills' Radiocapture.com website which is a web service that you can feed that automatically captures analogue and digital trunked radio conversations with an RTL-SDR, and allows public users to play back conversations via the web interface. The Radiocapture page which shows what the software is capable of is also active at radiocapture.com/radio.
Back in April Matt was fundraising via Patreon and hoping to make development of Radiocapture his day job, but unfortunately he's had to call it quits for now. Since he no longer has time to work on it, Matt has open sourced the RF side of the software. The software description reads:
[Radiocapture-rf] is capable of using multiple networked computers and multiple SDR radios to demodulate the control channel of P25, EDACS, and Motorola trunking systems, as well as some limited support (alpha quality) for scanning for systems, LTR trunking, and "police scanner" style audio capture.
It is designed to effectively scale to an infinite capacity of trunked systems, captured transmission volume, and dongle bandwidth (more dongles = more available bandwidth, more cpus = more channels and more systems). (There is one remaining feature to be implemented to really make this work well, dongle redis autodiscovery (frontend_connect should autodiscover and use available dongles) and splitting the rc_frontend/receiver.py into one process per dongle.
The frontend initializes the SDRs in whatever configured frequency range, and presents a server interface where clients can connect and request a specific channel be created and forward to them. The frontend will then attach a channel, and output to a UDP sink (might be something better now, I forget). On the backend side, a control_demodulator is listening to that sink and doing the actual RF demodulation, which is passed into redis for distribution to other services. The backend is effectively a bunch of microservices that work together to track & record all ongoing transmissions and do some amount of deduplication. This entire setup is designed such that it can be scaled across as many servers/computers as necessary (although there are a few caveats/things I never got around to implementing in how it actually works). Recorded transmissions are decorated with a metadata scheme in their mp3 tags that is designed to be able to be loaded into the Radiocapture.com database. Finally completed mp3s are dropped into an activemq queue for publishing.
Matt notes that the software in it's current state isn't considered as "ready to distribute" as you may need some decent experience with Linux and Python to get it up and running.
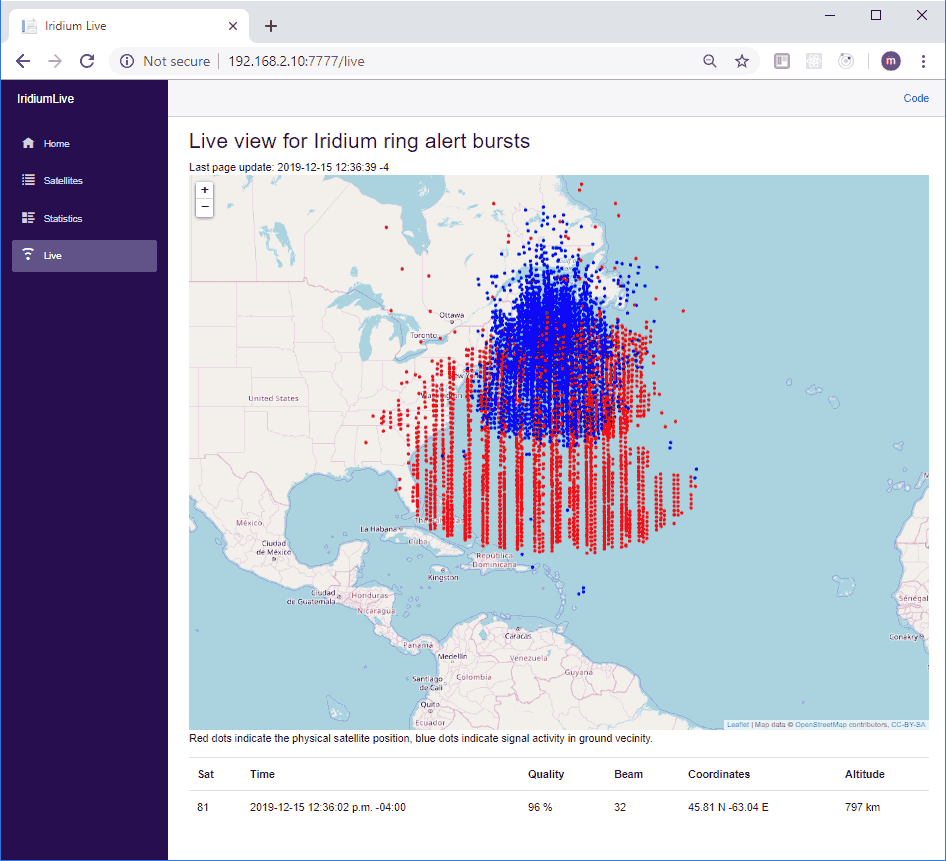
Over on GitHub, microp11, the author of Scytale-C has released a new browser based program called IridiumLive which allows you to visualize the live positions of Iridium satellites as they pass overhead. Iridium is a satellite constellation that provides services such as global paging, satellite phones, tracking and fleet management services, as well as services for emergency, aircraft, maritime and covert operations too.
The software uses gr-iridium as the data source, which is an RTL-SDR and other SDR compatible Iridium satellite decoder. See this very interesting talk by the gr-iridium authors for more information, and this video by Techminds which shows how to install and run gr-iridium.
Also in order to receive Iridium satellites in the first place, you'll need an appropriate antenna such as our "RTL-SDR Blog Active L-Band 1525 - 1637 Inmarsat to Iridium Patch Antenna Set" which is currently available on our store.
Instructions for installing and running IridiumLive are available on the Git readme. Once installed you can browse to the IridiumLive web page on your local network, and view the tracks of the Iridium satellite fleet as they pass overhead, as well as the locations of Iridium signal activity from the ground.
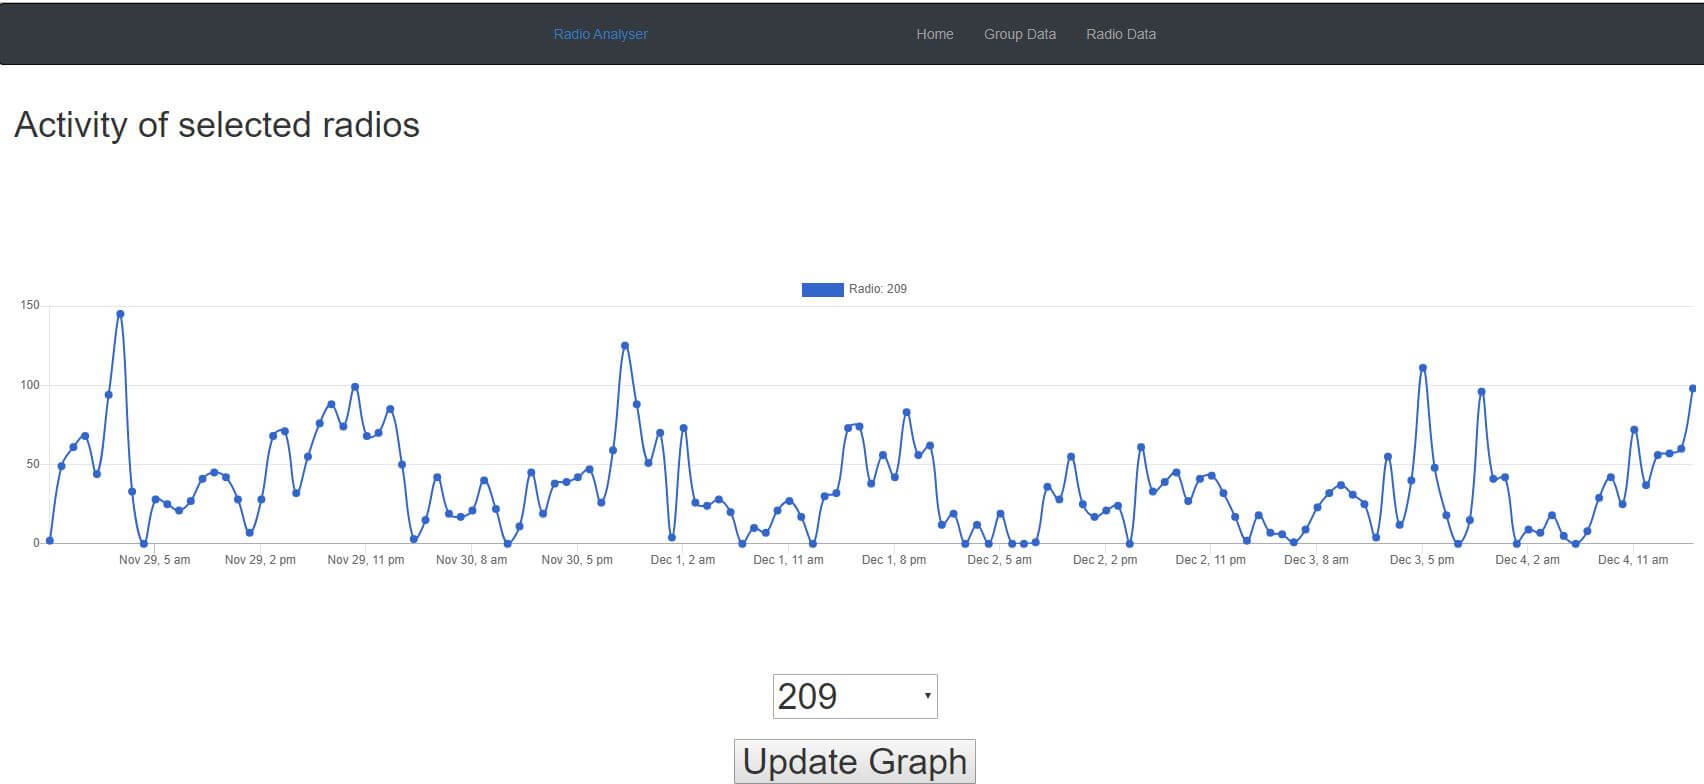
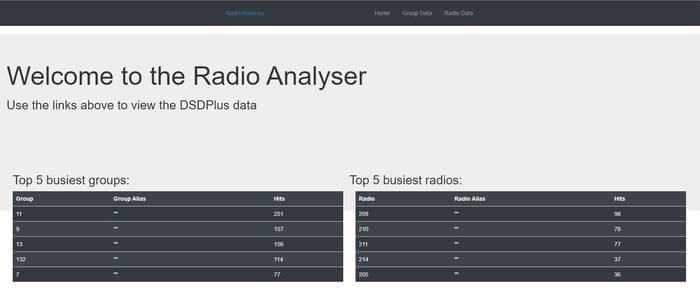
Thank you to Matthew Cowley for submitting news about his new program called "Radio Analyser". Radio Analyser is a program that imports DSDPlus radio and group files into a postgresql database. The data can then graphed on the web interface allowing you to view talk group and radio statistics. DSDPlus is a program that can be used to listen in to digital P25, DMR and other digital voice protocols with an RTL-SDR or similar SDR.
Matthew writes the following, and some screenshots of the interface and graphs are shown in the slider and the end of the post:
I've been learning Ruby on Rails and as a first project I wrote a project that you host at home which imports the DSDPlus.radios and DSDPlus.groups files and displays their activity in graph form. It will show you total site activity, talk group activity and radio activity.
Clayton wrote a simple Python script to plot the usage data extracted by rtlamr, and after a week determined that water was being consumed at 10 liters an hour even while away from home. Suspecting a leak in the toilets he turned off their valves and the next day saw that the reading remained constant when away, indicating that he'd found the leak.
A water leak graphed by decoding an Itron ERT water meter with RTL-SDR
KiwiSDR have recently implemented DRM decoding into their OpenWebRX implementation. Digital Radio Mondiale (DRM) is a type of digital shortwave radio signal that is used by some international shortwave radio broadcasters. It provides superior audio quality compared to AM stations thanks to digital audio encoding.
The KiwiSDR is a US$299 HF SDR that can monitor the entire 0 - 30 MHz band at once. It is designed to be web-based and shared, meaning that the KiwiSDR owner, or anyone that they've given access to can tune and listen to it via a web browser over the internet. Many public KiwiSDRs can be found and browsed from the list at sdr.hu.
The new DRM implementation is based on DREAM 2.1.1 which is an opensource DRM decoder that can be used with any HF capable SDR. Due to computational limits of the BeagleBone singleboard computer which the KiwiSDR runs on, only one DRM channel can be decoded at any one time, restricting this capability to only one user at a time. However, if the KiwiSDR is running on the newer BeagleBone AI, it can support up to four DRM channels. KiwiSDR write that work is still ongoing to improve the code, so this situation may improve in the future.
UPDATE: It has now been confirmed by Roscosmos that the satellite was struck by what is presumed to be a micrometeorite which caused a leak of thermal transfer gas, and hence a sudden orbit change. It seems unlikely that the satellite will begin operations again as the satellite cannot operate it's camera sensors without thermal cooling. Data is being transmit currently on the X-Band, however, it appears to be a stored image only, rather than live images.
On December 18, 2019, an abnormal situation was recorded on the Meteor-M spacecraft No. 2-2 associated with an external impact (presumably a micrometeorite) on its structure.As a result, he changed the parameters of the orbit and switched to a non-oriented flight mode with high angular velocities.
In accordance with the inherent logic of operation, the device stopped fulfilling the target task and automatically switched to energy-saving mode when the on-board systems that were not involved in ensuring its functioning (including all on-board target equipment) are turned off.
After entering into the zone of Russian ground-based controls with the Meteor-M spacecraft No. 2-2, communication was established and work began to restore its operability: damping angular velocities, transferring to the standard orientation, receiving telemetric and target information.
Currently, work is underway with the satellite under the program of the chief designer.Meteor-M No. 2-2 is in an oriented flight; regular control sessions are conducted with it to receive telemetric information and information from target equipment.
Meteor M N2-2 is a Russian weather satellite that was successfully launched into orbit on July 5 2019. Like with the NOAA and Meteor M N2 satellites, it is possible to receive weather satellite images from this satellite with an RTL-SDR (when it is operational).
The older but still operational Meteor M2 satellite has failed several times in it's history too, each time with the satellite entering an unstable tumble. However, each time the satellite was recovered back into full operation after a few days.
Message from Happysat Meteor M-N 2-2.Around 17/18 Dec lost orientation. Spent two days getting him back unther control again. Succeeded today. Now analysis is stil being carrieout before it becomes operational again. Why it came is still unknown. Thanks Alex.
Back in April 2019 we posted about Matt Mills' Radiocapture.com website which is a web service that you can feed that automatically captures analogue and digital trunked radio conversations with an RTL-SDR, and allows public users to play back conversations via the web interface. The Radiocapture page which shows what the software is capable of is also active at radiocapture.com/radio.
Back in April Matt was fundraising via Patreon and hoping to make development of Radiocapture his day job, but unfortunately he's had to call it quits for now. Since he no longer has time to work on it, Matt has open sourced the RF side of the software. The software description reads:
[Radiocapture-rf] is capable of using multiple networked computers and multiple SDR radios to demodulate the control channel of P25, EDACS, and Motorola trunking systems, as well as some limited support (alpha quality) for scanning for systems, LTR trunking, and "police scanner" style audio capture.
It is designed to effectively scale to an infinite capacity of trunked systems, captured transmission volume, and dongle bandwidth (more dongles = more available bandwidth, more cpus = more channels and more systems). (There is one remaining feature to be implemented to really make this work well, dongle redis autodiscovery (frontend_connect should autodiscover and use available dongles) and splitting the rc_frontend/receiver.py into one process per dongle.
The frontend initializes the SDRs in whatever configured frequency range, and presents a server interface where clients can connect and request a specific channel be created and forward to them. The frontend will then attach a channel, and output to a UDP sink (might be something better now, I forget). On the backend side, a control_demodulator is listening to that sink and doing the actual RF demodulation, which is passed into redis for distribution to other services. The backend is effectively a bunch of microservices that work together to track & record all ongoing transmissions and do some amount of deduplication. This entire setup is designed such that it can be scaled across as many servers/computers as necessary (although there are a few caveats/things I never got around to implementing in how it actually works). Recorded transmissions are decorated with a metadata scheme in their mp3 tags that is designed to be able to be loaded into the Radiocapture.com database. Finally completed mp3s are dropped into an activemq queue for publishing.
Matt notes that the software in it's current state isn't considered as "ready to distribute" as you may need some decent experience with Linux and Python to get it up and running.
Over on GitHub, microp11, the author of Scytale-C has released a new browser based program called IridiumLive which allows you to visualize the live positions of Iridium satellites as they pass overhead. Iridium is a satellite constellation that provides services such as global paging, satellite phones, tracking and fleet management services, as well as services for emergency, aircraft, maritime and covert operations too.
The software uses gr-iridium as the data source, which is an RTL-SDR and other SDR compatible Iridium satellite decoder. See this very interesting talk by the gr-iridium authors for more information, and this video by Techminds which shows how to install and run gr-iridium.
Also in order to receive Iridium satellites in the first place, you'll need an appropriate antenna such as our "RTL-SDR Blog Active L-Band 1525 - 1637 Inmarsat to Iridium Patch Antenna Set" which is currently available on our store.
Instructions for installing and running IridiumLive are available on the Git readme. Once installed you can browse to the IridiumLive web page on your local network, and view the tracks of the Iridium satellite fleet as they pass overhead, as well as the locations of Iridium signal activity from the ground.
Thank you to Matthew Cowley for submitting news about his new program called "Radio Analyser". Radio Analyser is a program that imports DSDPlus radio and group files into a postgresql database. The data can then graphed on the web interface allowing you to view talk group and radio statistics. DSDPlus is a program that can be used to listen in to digital P25, DMR and other digital voice protocols with an RTL-SDR or similar SDR.
Matthew writes the following, and some screenshots of the interface and graphs are shown in the slider and the end of the post:
I've been learning Ruby on Rails and as a first project I wrote a project that you host at home which imports the DSDPlus.radios and DSDPlus.groups files and displays their activity in graph form. It will show you total site activity, talk group activity and radio activity.
Software defined radios can have many more applications other than just radio. For example, it's possible to connect an ultrasonic sensor which outputs a waveform at some frequency above DC directly to the input of an SDR. We can then simply treat the sensor output as an RF signal, and view it in any SDR compatible software that shows us a spectrum. Normally you'd use a microcontroller with ADC to process the output of these sensors, but using an SDR makes visualizing and experimenting with these sensors much easier.
Over on YouTube W1VLF has uploaded a video showing his experiments with an ultrasonic sensor connected to his Airspy HF+. In his experiment he places the Airspy HF+ with directly connected ultrasonic sensor in one room, and sets up an ultrasonic emitter in another room. He then uses SDR# to view the 24 kHz ultrasonic sensor signal output on the computer. As he moves the sensor around it's possible to clearly see the doppler shift of the ultrasonic sound waves on the waterfall.
In the past we've also posted about Jan de Jong who experimented with using a piezo speaker connected to an SDRplay RSP1A to detect the ultrasonic navigation sounds from bats.
Back in the middle of last year we posted about Othernet's Dreamcatcher hardware and the LoRa chat application. The Dreamcatcher is Othernet's receiver and computing platform that is designed for receiving their satellite data broadcast. It is currently available for US$79.
Although the Othernet datacast is one way receive only, the Dreamcatcher board uses a LoRa radio chipset that has TX capabilities that can be leveraged for experimental purposes. One experimental piece of software that they developed is a chat application that works with two Dreamcatcher boards. It allows you to initiate a text based chat between two boards using the on board LoRa radio chips.
The TechMinds YouTube channel has recently released a video demonstrating the chat application in action, and the video shows how to set up, install and use it too. We note that since our post last year, the Dreamcatcher board has gone through a revision and no longer includes an LCD screen. The company name has also changed from "Outernet" to "Othernet".
What can you do with two Othernet Dreamcatcher Boards?