Using an RTL-SDR to Measure the Basis for the Dark Matter Hypothesis

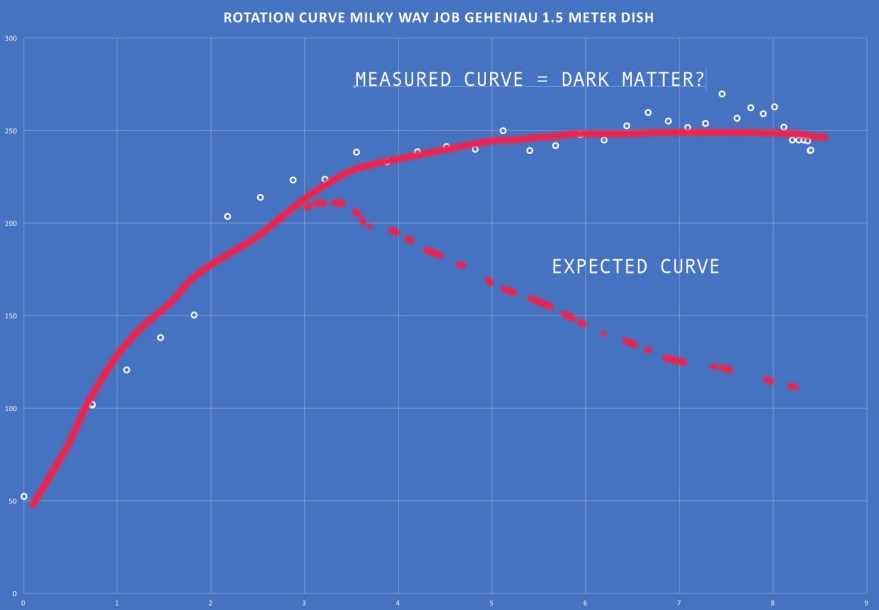
From calculations depending on the distribution of visible star mass in our galaxy, a certain galactic rotational velocity vs distance from center curve is expected. However, when scientists actually measure the galactic rotation, another curve is found - a curve which should result in the galaxy flying apart. This mismatch in expected vs measured data has given rise to the theory of "dark matter". The theory essentially states that in order to get the measured curve, the galaxy must have more mass, and that this mass must come from non-luminous matter scattered amongst the galaxy which is difficult or impossible to observe.

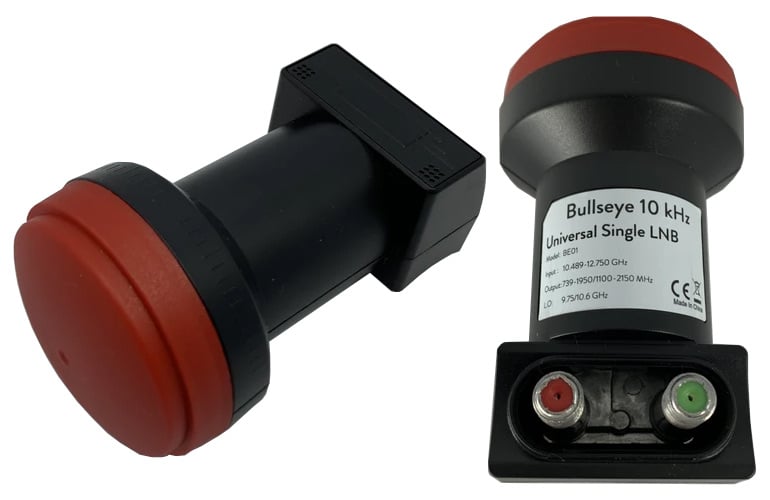
In the past we have posted about Job Geheniau's radio astronomy projects a few times on this blog. So far he has used an RTL-SDR and radio telescope dish to generate a full radio image of the galaxy at the Hydrogen Line frequency of 1.42 GHz. This project worked by pointing the telescope at one section of the galaxy, measuring the total Hydrogen line power with the RTL-SDR over a number of minutes, then moving the telescope to the next section.

Job's Radio Telescope + Laptop and RTL-SDR Setup

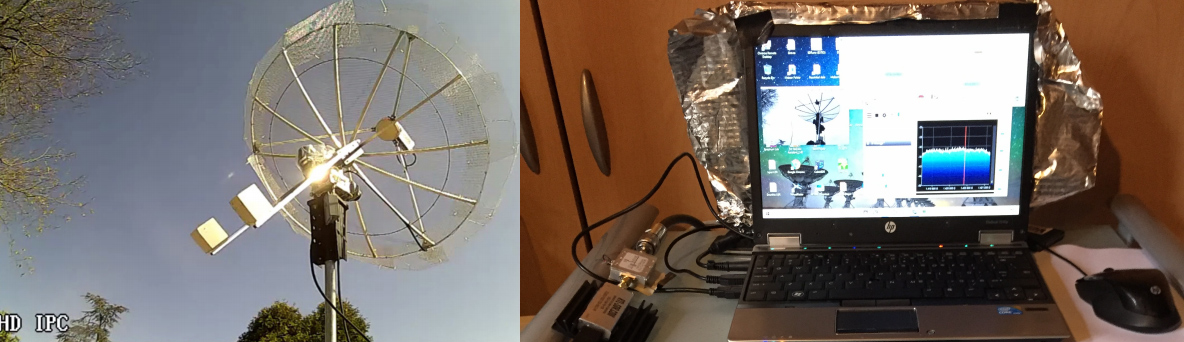
Using the same hardware and techniques to observe the Hydrogen Line frequency, he was now able to measure the rotational curve of our galaxy. When the telescope points to different arms of the galaxy, the Hydrogen line measurement will be doppler shifted differently. The measured doppler shift can be used to figure out the rotational velocity of that particular arm of the galaxy. By measuring the rotational velocity from the center of the galaxy to the outer edges, a curve is created. Job's measured curve matches that seen by professional radio astronomers, confirming the mismatch in expected vs measured data.

Job's document explaining his setup and measurement procedure can be found here (pdf file).

Job's Measured vs Expected Curve

If you'd like to get started with Hydrogen line radio astronomy with an RTL-SDR, we have a tutorial over here.

Simple APCO P25 Phase 1 Decoder Plugin Released for SDR#

Vasili, author of several SDR# plugins has recently released a new APCO P25 plugin for SDR#. The plugin is easy to use, simply tune to a P25 voice signal, and it will automatically decode it into voice audio assuming that the signal is not encrypted. If the P25 signal is encrypted, you will hear garbled unintelligible voice. The plugin does not support trunking or any advanced talk group filtering features that you might find with DSD+, Unitrunker, SDR Trunk etc.

To install the plugin, simply download the zip file from rtl-sdr.ru and extra the .dll's into the SDR# folder. Then copy the text in magicline.txt file into the plugins.xml file inside the SDR# folder. The plugin should work with any SDR supported by SDR#, including the RTL-SDR.

The simple APCO P25 decoder for SDR#

Conference Talk on PICTOR A Free-to-Use Open Source Radio Telescope based on RTL-SDR

At this years FOSDEM 2020 conference Apostolos Spanakis-Misirlis has presented a talk on his PICTOR open source radio telescope project. We have posted about PICTOR in the past [1, 2] as it makes use of an RTL-SDR dongle for the radio observations. The PICTOR website and GitHub page provide all the information you need to build your own Hydrogen line radio telescope, and you can also access their free to use observation platform, where you can make an observation using Apostolos' own 3.2m dish radio telescope in Greece.

The PICTOR radio telescope allows a user to measure hydrogen line emissions from our galaxy. Neutral Hydrogen atoms randomly emit photons at a wavelength of 21cm (1420.4058 MHz). The emissions themselves are very rare, but since our galaxy is full of hydrogen atoms the aggregate effect is that a radio telescope can detect a power spike at 21cm. If the telescope points to within the plane of our galaxy (the milky way), the spike becomes significantly more powerful since our galaxy contains more hydrogen than the space between galaxies. Radio astronomers are able to use this information to determine the shape and rotational speed of our own galaxy.

PICTOR: A free-to-use open source radio telescope

SDR Sharp Slicer Now Supports RTL-SDR and other SDRs

Youssef, Author of the SDR# software has recently updated SDR#, now extending the Sharp Slicer functionality which we posted about earlier to RTL-SDR and other supported software defined radios. The latest version of SDR# can be obtained from the Airspy Downloads page as usual.

This feature allows SDR users to open multiple instances of SDR#, each able to tune to a seperate signal within the currently tuned frequency range of the SDR. This is somewhat similar to the old multi-VFO plugin from rtl-sdr.ru, however the advantage of Slicer is that you can have seperate spectrum and waterfall graphs for each signal.

Other recent changes include 'true dBFS' automatic scaling, where 0 dBFS now indicates that the ADC is likely saturated.

SDR# Sharp Slicer Monitoring 5 Broadcast FM Stations Simultaneously.

Tracking RTL-SDR Passive Radar Detections with a Kalman Filter

Back in January we posted about Max Manning's work about building a passive radar system out of two RTL-SDR dongles modified to share the same local oscillator. He's recently extended this code, adding the ability to automatically track any detected objects on the range-doppler display.

Passive Radar works by using already existing powerful transmitters such as those for TV/FM. A receiver listens for these signals being reflected off of objects like aircraft and vehicles, and compares the reflection with a signal received directly from the transmitter. From this information a doppler (speed) vs range graph of detected objects can be calculated and displayed.

By measuring the path an object travels across the range-doppler display some interesting information about the objects movement can be obtained. However, the display can be noisy, with the reflected object often coming in and out of view on the display. In order to track an object across the range-doppler display in the face of these uncertainties Max uses a Kalman filter to obtain smoothed results. A Kalman filter is an algorithm which combines actual data with predicted data, with the weighting depending on measurement confidence. The result is shown in the video below. A smooth and accurate track of an aircraft can be seen.

Max notes that in the future he'll be working on tracking multiple aircraft detected by the passive radar, and also incorporating direction finding data in his results in order to get cartesian coordinates which could be plotted on a map.

We note that Max's GNU Radio code should be compatible with our KerberosSDR unit, which already has the clock sharing hack built in to the hardware.

Bullseye TCXO LNB for QO-100 33% Off Sale Ending Soon

On September 15 we began our 33% off stock reduction sale for the Bullseye LNB. The Bullseye is an ultra stable LNB for receiving QO-100 and other Ku-Band satellites/applications. We'll be ending this sale on Wednesday, so if you'd like to purchase a unit please order soon to avoid missing out on the sale price. The current sale price is US$19.97 including free worldwide shipping to most countries. 

To order the product, please go to our store, and scroll down until you see the QO-100 Bullseye TCXO LNB heading. Alternatively we also have stock via our Aliexpress store or on eBay.

For more information about the Bullseye and some reviews please see the original sale post.

The Bullseye LNB for QO-100

Microwave Humidity Sounder Decoder for the NOAA-19 Satellite Released

Back in June we posted about the release of  Zbigniew Sztanga's NOAA-HIRS-Decoder which can decode HIRS instrument data which measures the vertical temperature profile of the Earth's surface. This HIRS signal is broadcast by NOAA satellites at the same time as their APT images and the HIRS frequency is close by at 137.350 MHz. 

Recently Zbigniew has released a new decoder for the Microwave Humidity Sounder (MHS) instrument which is available on NOAA-19 only. This MHS instrument observes the Earth in the 89-190 GHz microwave band, which can be useful for measuring humidity levels. However, unlike the APT and HIRS signals which downlink data at around 137 MHz, the MHS data is broadcast in the L-band within the HRPT signal, so a motorized or tracked satellite dish will be required to receive it. Zbigniew writes:

The MHS (Microwave humidity sounder) is an instrument on NOAA-18 and NOAA-19. It replaced the older AMSU-B. It has a resolution of 90px per line and 5 channels.
 
Data from the instrument is present in HRPT and can be decoded with my new software. Unfortunately, only MHS on N-19 is working, because N-18's NHS is dead.
 
The instrument can be used to monitor low clouds, percipation and water vaopr in the atmosphere. I attached a sample image to the email.
 
It's available on the same repo as Aang23' HRPT decoders: https://github.com/altillimity/L-Band-Decoders/tree/master/NOAA%20MHS%20Decoder
Microwave Humidity Sounder data from NOAA-19.

Sanchez Updates: Combine Weather Images from GK-2A, Himawari-8, GOES 16/17 Satellites into one Composite Image

Back in August we posted about the release of Sanchez, a tool originally designed to apply a color underlay image to grayscale infrared images received from geostationary weather satellites such as GOES 16/17, Himawari-8 and GK-2K. The tool has recently been updated with some very nice new features.

One of the new features is the ability to composite together images obtained from multiple satellites in order to form a full equirectangular image of the earth with live cloud cover. Another feature is the ability to use two or more images from different satellites to reproject back to geostationary projection at a specified longitude, essentially creating an image from a virtual satellite.

Image composed of GK-2A, Himawari-8, GOES-16 and GOES-17 satellites (full resolution images available at https://github.com/nullpainter/sanchez/wiki/Sample-images