Dr. Marc Lichtman has recently released his free online PySDR guide to Digital Signal Processing (DSP) explained with the help of software defined radio and Python code. Over the years we've seen numerous SDR & DSP courses come out, some requiring payment and some free. We note that this guide is completely free, and appears to be one of the better if not the best guide in terms of explaining DSP fundamental concepts in an easy to understand way. A lot of visualizations and animations are used which really help anyone new to the subject.
While the explanations are very good, please note that this is still a technical University level guide intended for Computer Science or Engineering students, so prerequisite knowledge is required. Dr. Marc recommends it for someone who is:
Interested in using SDRs to do cool stuff
Good with Python
Relatively new to DSP, wireless communications, and SDR
A visual learner, preferring animations over equations
Better at understanding equations after learning the concepts
Looking for concise explanations, not a 1000 page textbook
The SDR hardware used in the book examples is the PlutoSDR which is a fairly low cost SDR intended for use by students. However, the PlutoSDR isn't required as most of the code examples use generated data.
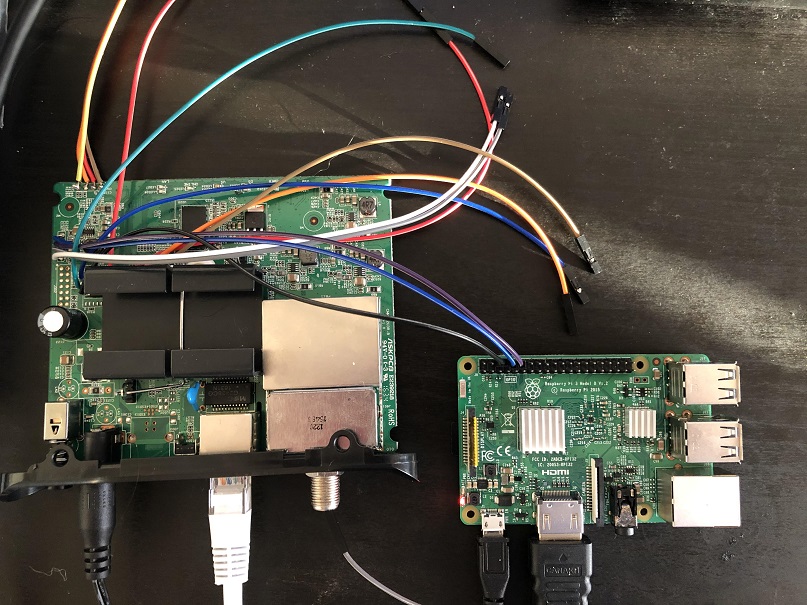
To begin the investigation stdw first opened the case and looked for a serial UART port. After finding one he connected the UART up to a Raspberry Pi and was almost immediately able to connect to the device's terminal. From the information displayed during the boot process, stdw was able to determine that the modem was running the eCos operating system on a Broadcom BCM3383 SoC. Unfortunately after receiving that information the UART connection is dropped, preventing any further terminal investigation.
To get around this issue, stdw decided to dump the flash memory via an SPI memory chip he saw on the board. Again using the Raspberry Pi he was able to connect via SPI and use the flashrom tool to read the memory. Next using a tool called bcm2-utils, stdw was able to parse and actually modify the configuration information stored in the flash memory. With this he was able to modify the configuration so that the serial connection did not drop after boot.
With terminal access gained, stdw was now able to reverse engineer the firmware, and after a lot of searching eventually find a console command which would perform a bandpower measurement for a given frequency range. He found that IQ data for this scan was stored in a buffer which he could then stream out via a TCP connection. With the IQ data finally available on another PC he was then able to use Python libraries to compute an FFT and actually visualize the scanned spectrum. Some further investigation yielded actually demodulated FM audio, and the realization that the usable bandwidth is 7.5 MHz.
Unfortunately there were some limitations. There is only enough RAM to store less than a second of data at a time at max bandwidth and precision, which meant that a lot of data needed to be dropped in between captures. Further investigation yielded methods to reduce the sample rate down to 464 kHz which meant that only 12% of data was ever dropped - enough to stream a wideband FM radio signal.
If you wanted to try investigating the modem yourself, the Motorola MB7220 is available second hand on eBay for prices ranging between US$15 - US$40, and new on Amazon for $46.99. Although the usability of the modem for any real SDR applications may not be great, further investigation may yield better results. And if not, following along with the process stdw took looks to be a great reverse engineering learning experience. Other modems that use similar Broadcom chips may also be worth investigating.
The Motorola MB7220 connected to a Raspberry Pi for reverse engineering
Recently we posted about new updates to the Sanchez software. The updates allow users to combine images received from multiple geostationary weather satellites such as GOES 16/17, Himawari-8, GK-2A and Electro. The images can also be reprojected into a flat equirectangular image, and then optionally reprojected back into a disk view at any location on earth. Sanchez's original function is also still there which allows users to add a false color underlay image to grayscale infrared images received from the satellites.
Sanchez is a command line tool, so scripts are required to do anything interesting. Over on his page Carl Reinemann has uploaded a page with a number of Sanchez command line examples available. The page shows examples like how to stitch together multiple images, and how to create a stitched time lapse animation. The YouTube video below shows an example of an animation Carl created with Sanchez and GOES 16 and 17 images stitched together.
GOES 16-17 Composite imagery
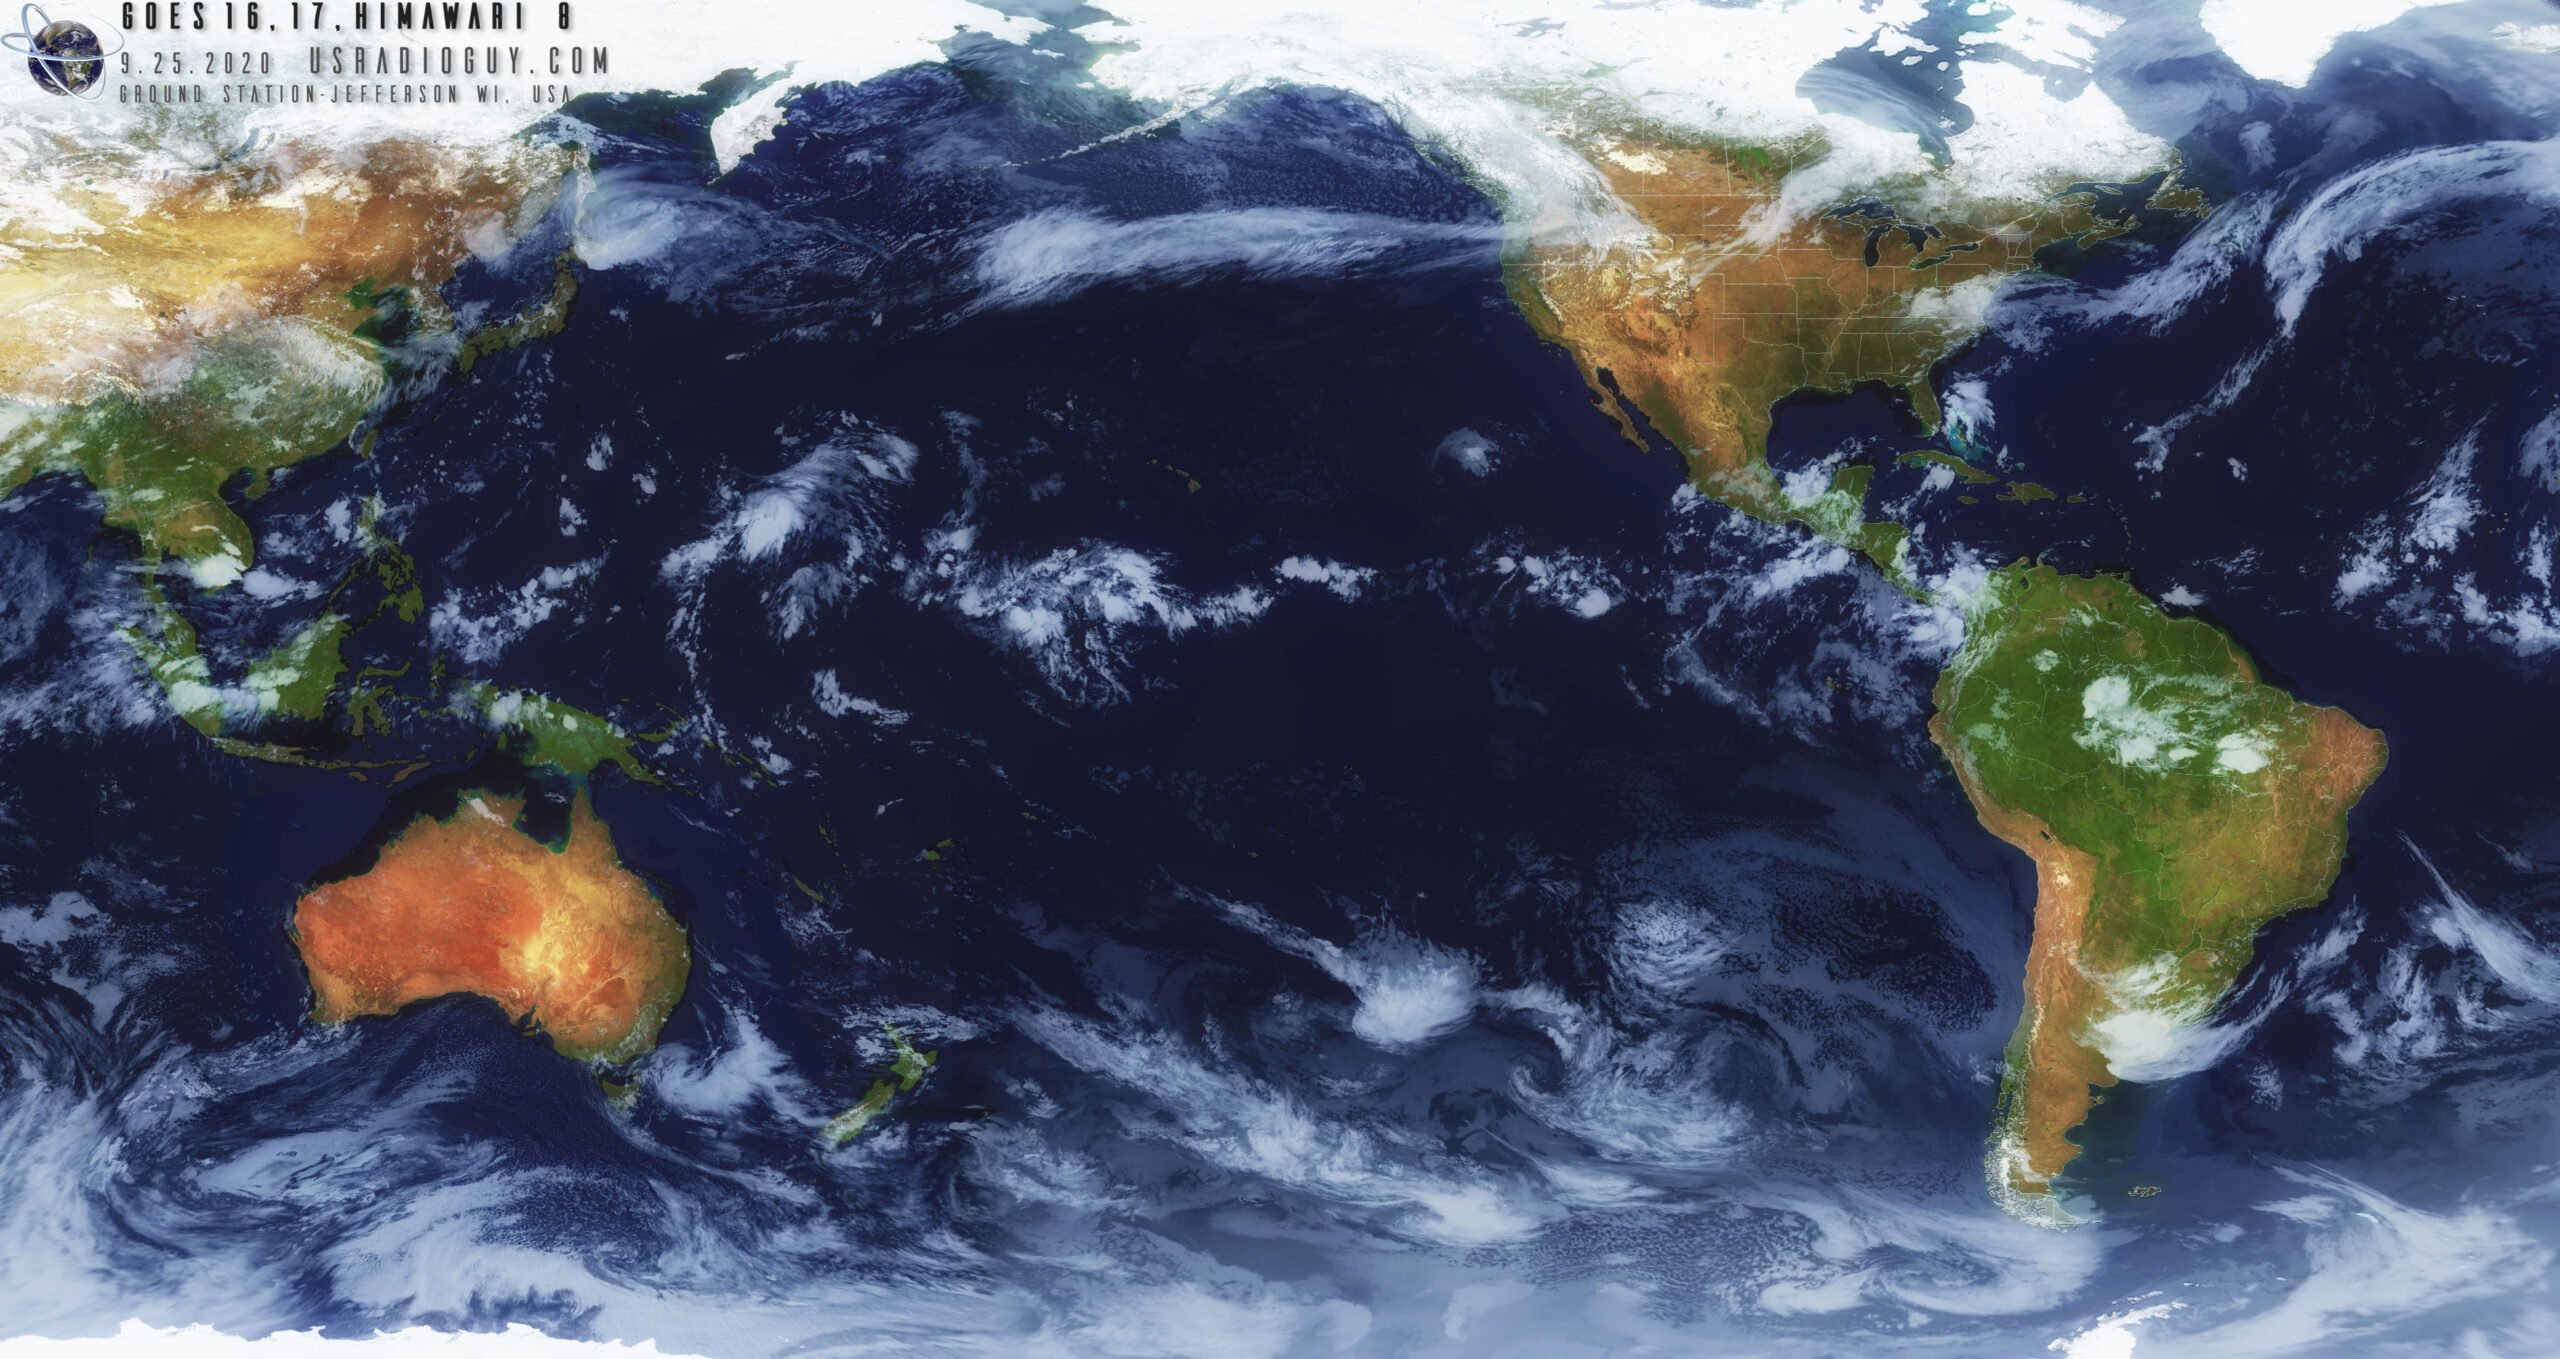
And the image below is an example of an image of Himawari 8, GOES 16 and 17 he stitched together with Sanchez.
GOES 16 and 17 composite created by Carl Reinemann via Sanchez
Over on his YouTube channel Tech Minds has recently released a new video demonstrating how to use an RTL-SDR portably via an Android tablet and an OTG cable. In the video he goes through the various Android software options available including general receiver software such as RF Analyzer (free) and SDR Touch (£5.99) as well as AVARE ADSB for ADS-B aircraft reception. He goes on to demonstrate each program in action.
Portable RTL - SDR Software Defined Radio with Android
Over on the SDRplay blog Jon has posted about the STRATONAV experiment which makes use of the SDRplay RSP1 software defined radio. The STRATONAV experiment uses high altitude balloons to carry the RSP1 as well and a commercial portable receiver. The two receivers were configured to receive aircraft VOR navigation signals in order to test the effectiveness of VOR when used at extreme altitudes of up to 28 km. The VOR navigational data was then compared against GPS tracks, resulting in a measure of how well VOR worked at those altitudes.
VOR (aka VHF Omnidirectional Range) is a navigational beacon that is transmitted between 108 MHz and 117.95 MHz from a site usually at an airport. In the past we have posted about VOR a few times as it can also be decoded with an RTL-SDR, or used for passive doppler aircraft radar.
The results showed that VOR navigation does indeed continue to function at extreme altitudes, proving that it can be used as a back up navigation system for stratospheric platforms. They also note that VOR navigation could also be used as a primary navigation system on smaller stratospheric platforms due to its low cost and low complexity to implement.
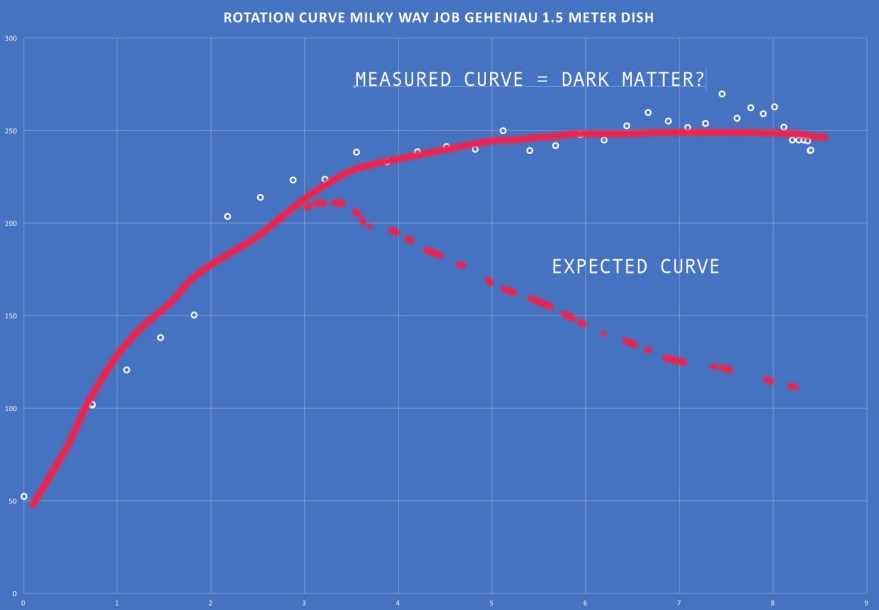
From calculations depending on the distribution of visible star mass in our galaxy, a certain galactic rotational velocity vs distance from center curve is expected. However, when scientists actually measure the galactic rotation, another curve is found - a curve which should result in the galaxy flying apart. This mismatch in expected vs measured data has given rise to the theory of "dark matter". The theory essentially states that in order to get the measured curve, the galaxy must have more mass, and that this mass must come from non-luminous matter scattered amongst the galaxy which is difficult or impossible to observe.
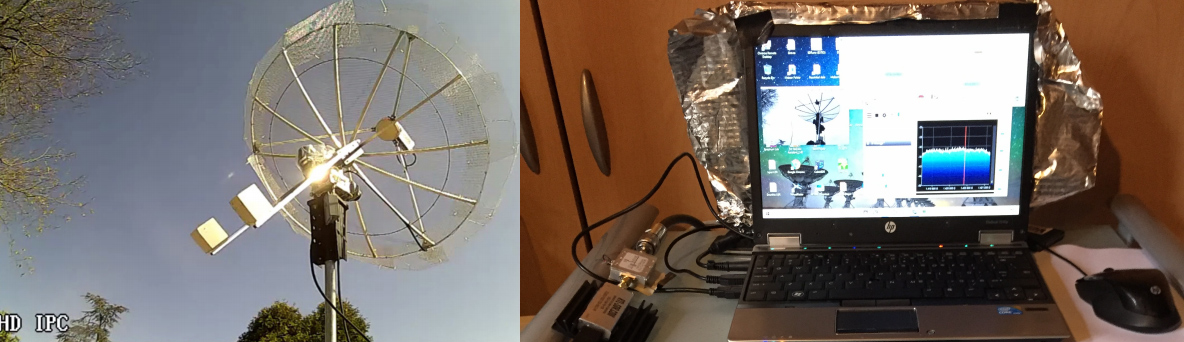
In the past we have posted about Job Geheniau's radio astronomy projects a few times on this blog. So far he has used an RTL-SDR and radio telescope dish to generate a full radio image of the galaxy at the Hydrogen Line frequency of 1.42 GHz. This project worked by pointing the telescope at one section of the galaxy, measuring the total Hydrogen line power with the RTL-SDR over a number of minutes, then moving the telescope to the next section.
Job's Radio Telescope + Laptop and RTL-SDR Setup
Using the same hardware and techniques to observe the Hydrogen Line frequency, he was now able to measure the rotational curve of our galaxy. When the telescope points to different arms of the galaxy, the Hydrogen line measurement will be doppler shifted differently. The measured doppler shift can be used to figure out the rotational velocity of that particular arm of the galaxy. By measuring the rotational velocity from the center of the galaxy to the outer edges, a curve is created. Job's measured curve matches that seen by professional radio astronomers, confirming the mismatch in expected vs measured data.
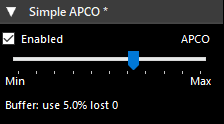
Vasili, author of several SDR# plugins has recently released a new APCO P25 plugin for SDR#. The plugin is easy to use, simply tune to a P25 voice signal, and it will automatically decode it into voice audio assuming that the signal is not encrypted. If the P25 signal is encrypted, you will hear garbled unintelligible voice. The plugin does not support trunking or any advanced talk group filtering features that you might find with DSD+, Unitrunker, SDR Trunk etc.
To install the plugin, simply download the zip file from rtl-sdr.ru and extra the .dll's into the SDR# folder. Then copy the text in magicline.txt file into the plugins.xml file inside the SDR# folder. The plugin should work with any SDR supported by SDR#, including the RTL-SDR.
At this years FOSDEM 2020 conference Apostolos Spanakis-Misirlis has presented a talk on his PICTOR open source radio telescope project. We have posted about PICTOR in the past [1, 2] as it makes use of an RTL-SDR dongle for the radio observations. The PICTOR website and GitHub page provide all the information you need to build your own Hydrogen line radio telescope, and you can also access their free to use observation platform, where you can make an observation using Apostolos' own 3.2m dish radio telescope in Greece.
The PICTOR radio telescope allows a user to measure hydrogen line emissions from our galaxy. Neutral Hydrogen atoms randomly emit photons at a wavelength of 21cm (1420.4058 MHz). The emissions themselves are very rare, but since our galaxy is full of hydrogen atoms the aggregate effect is that a radio telescope can detect a power spike at 21cm. If the telescope points to within the plane of our galaxy (the milky way), the spike becomes significantly more powerful since our galaxy contains more hydrogen than the space between galaxies. Radio astronomers are able to use this information to determine the shape and rotational speed of our own galaxy.